Fig. 8
Download original image
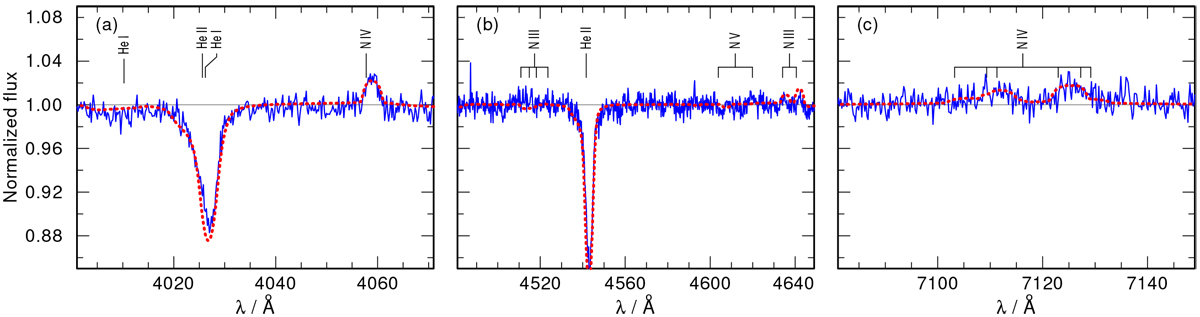
Observed X-shooter spectrum (ID 5 in Table 1) and synthetic spectra of selected regions that show nitrogen emission lines. The observed spectrum is shown as a solid blue line, while the dotted red line is our best-fitting model. The observed spectrum is corrected for the velocity of the SMC and the barycentric motion. The line identification marks correspond to the wavelengths in the rest frame. Panel a shows the area around the N IV λ4057. Panel b shows the region of N III λλ4511−4523, N V λλ4604, 4620, and N III λλ4634, 4641. The N III and N V lines are not observable in the spectrum. Panel c shows the region of the N IV λλ7103−7129 complex.
Current usage metrics show cumulative count of Article Views (full-text article views including HTML views, PDF and ePub downloads, according to the available data) and Abstracts Views on Vision4Press platform.
Data correspond to usage on the plateform after 2015. The current usage metrics is available 48-96 hours after online publication and is updated daily on week days.
Initial download of the metrics may take a while.