Fig. 6
Download original image
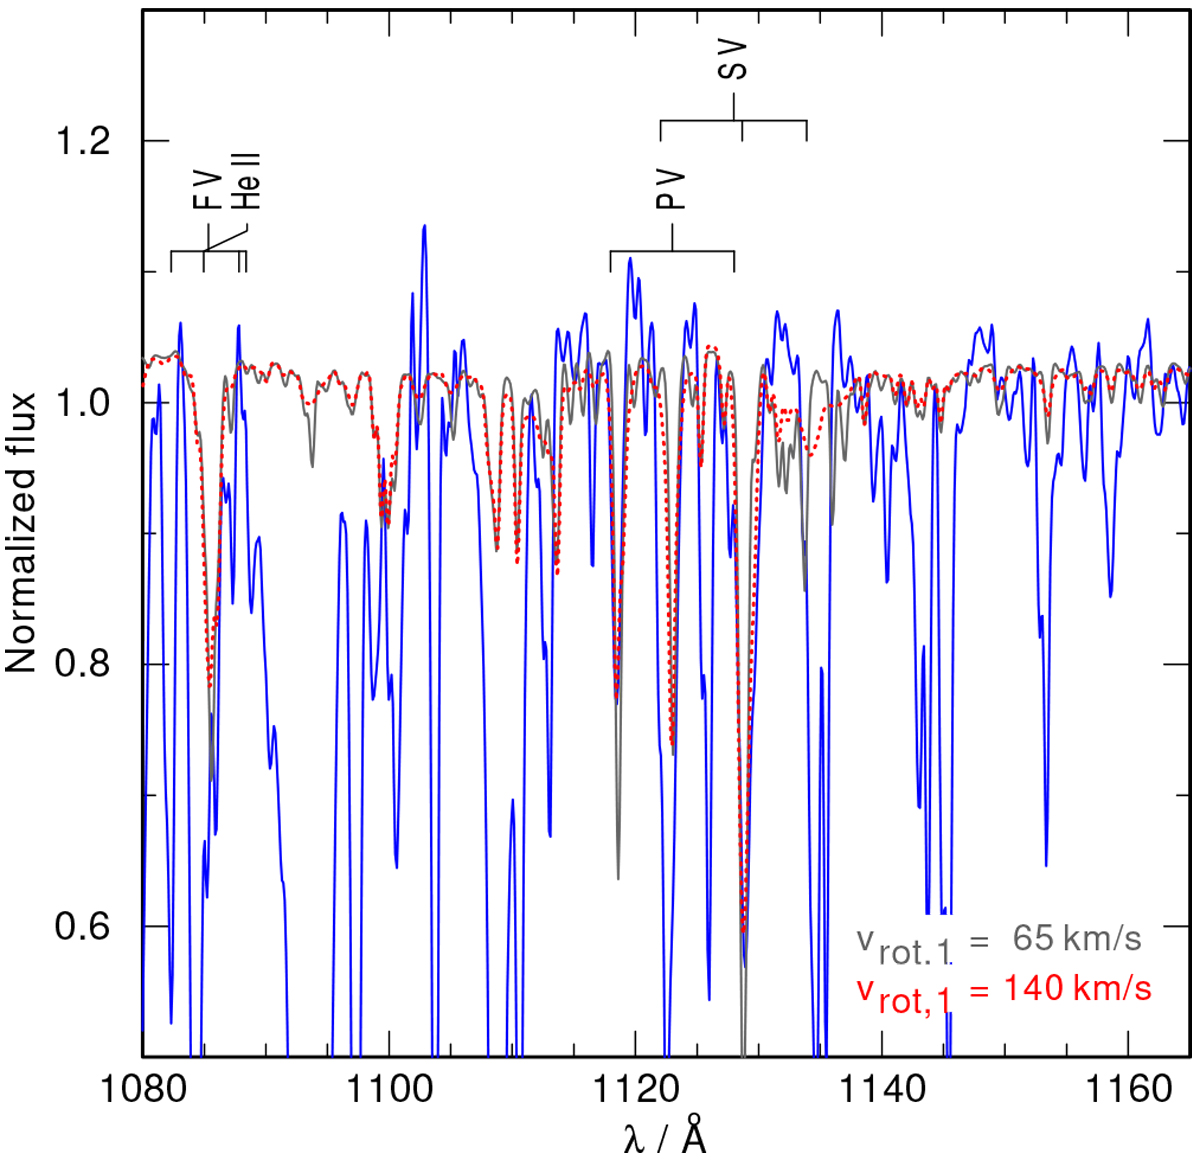
Part of the observed FUSE spectrum (ID 1 in Table 1) covering the wavelength range of the LiF2 channel – the same as used by Penny & Gies (2009) to determine the projected rotational velocity. The observed spectrum, corrected for the velocity of the SMC, is shown as a solid blue line. The red dotted line is our best-fitting model with the primary’s projected rotational velocity v1 sin i = 140 km s−1. The gray solid line is another model where the primary’s projected rotational velocity is reduced to v1 sin i = 140 km s−1. The line identification marks correspond to the wavelengths in the rest frame.
Current usage metrics show cumulative count of Article Views (full-text article views including HTML views, PDF and ePub downloads, according to the available data) and Abstracts Views on Vision4Press platform.
Data correspond to usage on the plateform after 2015. The current usage metrics is available 48-96 hours after online publication and is updated daily on week days.
Initial download of the metrics may take a while.