Fig. 5
Download original image
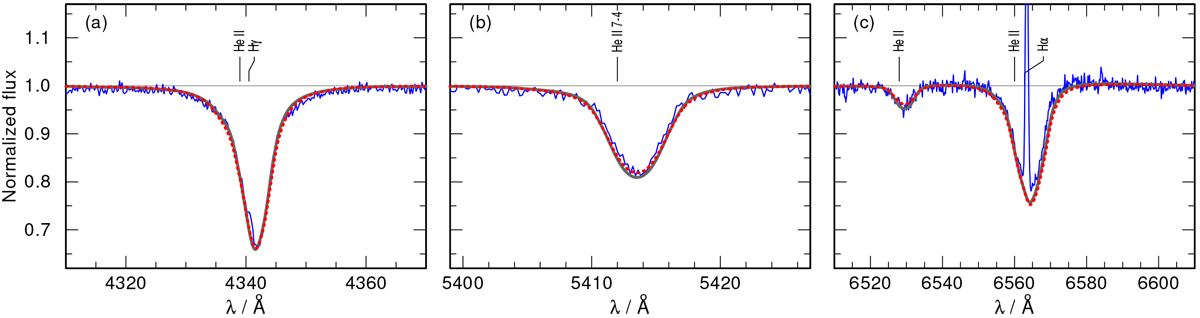
Selected regions of the X-shooter spectrum (ID 5 in Table 1) compared to different synthetic spectra. The observed spectrum, corrected for the velocity of the SMC and the barycentric motion, is shown as a solid blue line. The red dotted line is our best-fitting model which consists of the primary with Teff, 1 = 42 kK and log g*, 1 = 3.7 and the secondary with Teff, 2 = 32 kK and log g*, 1 = 4.0. The gray solid line is again a combined synthetic spectrum of the primary and secondary, but this time the surface gravity of the primary has been reduced to log g*, 1= 3.6 (and the temperature and mass-loss rate are slightly adjusted so that the spectrum matches the observations) while the parameters of the secondary are kept fixed. The line identification marks correspond to the wavelengths in the rest frame. Panel a shows the Hγ line, in which the red wing is dominated by the primary and the blue wing by the secondary. Panel b shows the He II λ5412 absorption line, which is dominated by the primary and is sensitive to surface gravity. Panel c shows the region of He II λ6528 and Hα. While the Hα wings are only barely affected by the change in logg*, 1, the He II λ6528 line is more sensitive to it.
Current usage metrics show cumulative count of Article Views (full-text article views including HTML views, PDF and ePub downloads, according to the available data) and Abstracts Views on Vision4Press platform.
Data correspond to usage on the plateform after 2015. The current usage metrics is available 48-96 hours after online publication and is updated daily on week days.
Initial download of the metrics may take a while.