Fig. 3
Download original image
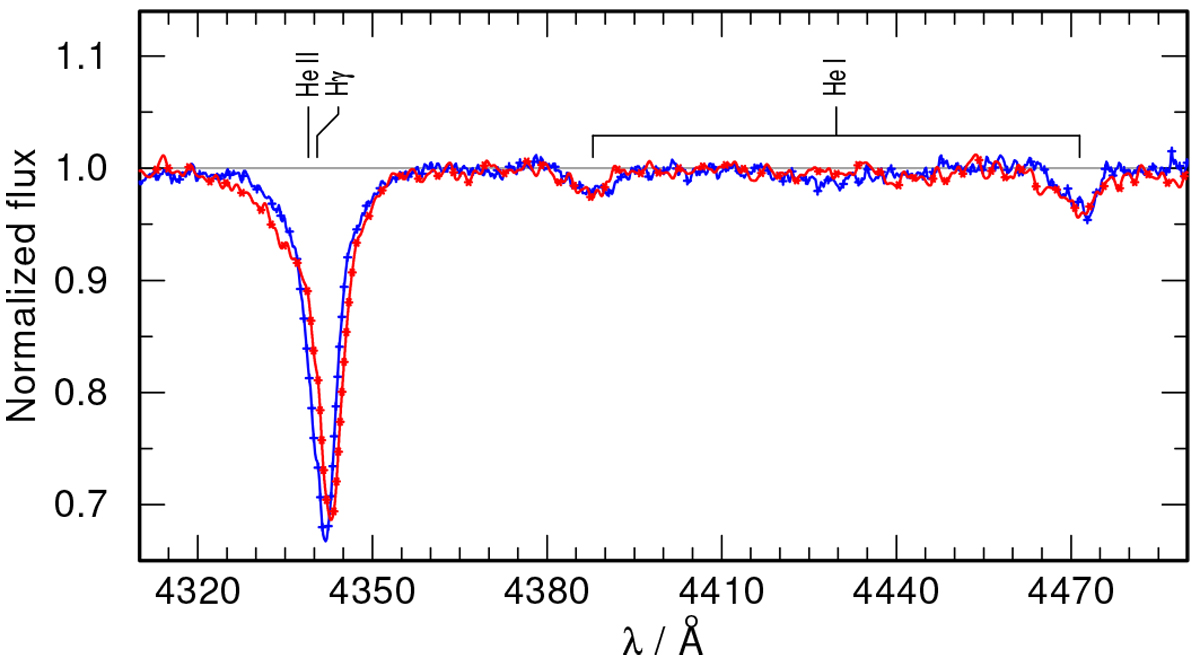
X-shooter spectrum (ID 5 in Table 1) displayed in blue and one of the UVES spectra (ID 10 in Table 1) in red. The spectra are convolved with a Gaussian with an FWHM = 0.4 Å to reduce the noise and to make the RV shifts visible. The region containing Hγ, He I λ4387, and He I λ4471 lines is shown. In the spectrum shown by the red line, the primary’s spectrum is redshifted (see Hγ), while the secondary’s spectrum (broadened He I lines) is blueshifted. We note that the primary also partially contributes to the He I lines.
Current usage metrics show cumulative count of Article Views (full-text article views including HTML views, PDF and ePub downloads, according to the available data) and Abstracts Views on Vision4Press platform.
Data correspond to usage on the plateform after 2015. The current usage metrics is available 48-96 hours after online publication and is updated daily on week days.
Initial download of the metrics may take a while.