Fig. 2
Download original image
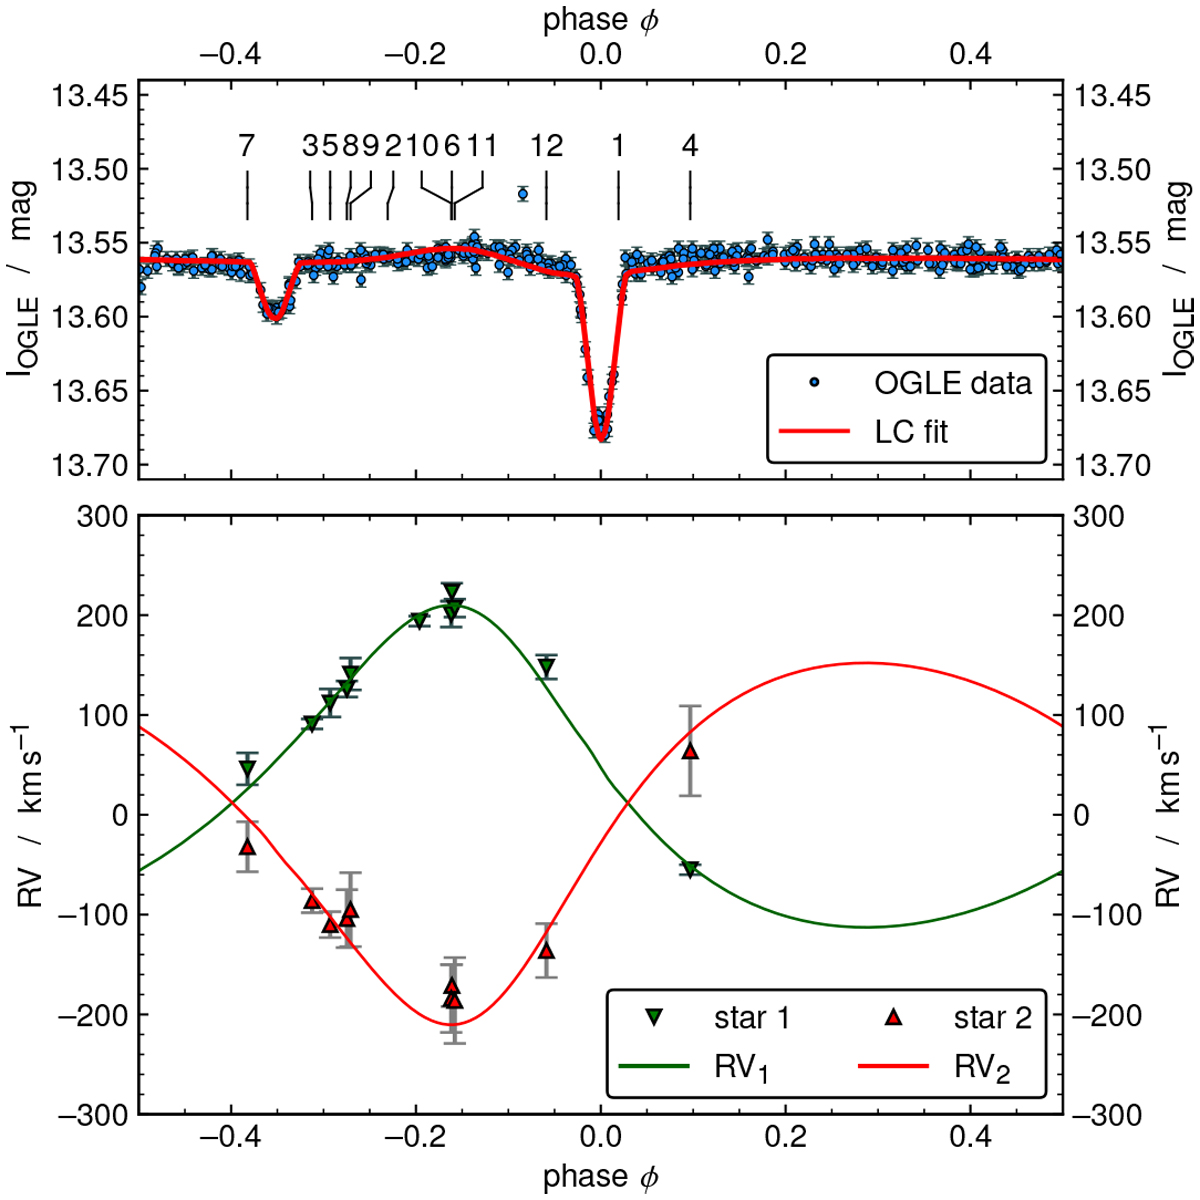
Upper panel: phased OGLE I-band light curve of AzV 476 (blue dots) and the best fit obtained with the PHOEBE code (red line). Above the light curve, the spectral IDs of all used spectra (see Table 1) are indicated. Lower panel: observed (triangles) and fitted (solid lines) RV curves for the primary (green) and secondary (red). The fits of the light-curve fit and the RVs are consistently obtained by the PHOEBE code.
Current usage metrics show cumulative count of Article Views (full-text article views including HTML views, PDF and ePub downloads, according to the available data) and Abstracts Views on Vision4Press platform.
Data correspond to usage on the plateform after 2015. The current usage metrics is available 48-96 hours after online publication and is updated daily on week days.
Initial download of the metrics may take a while.