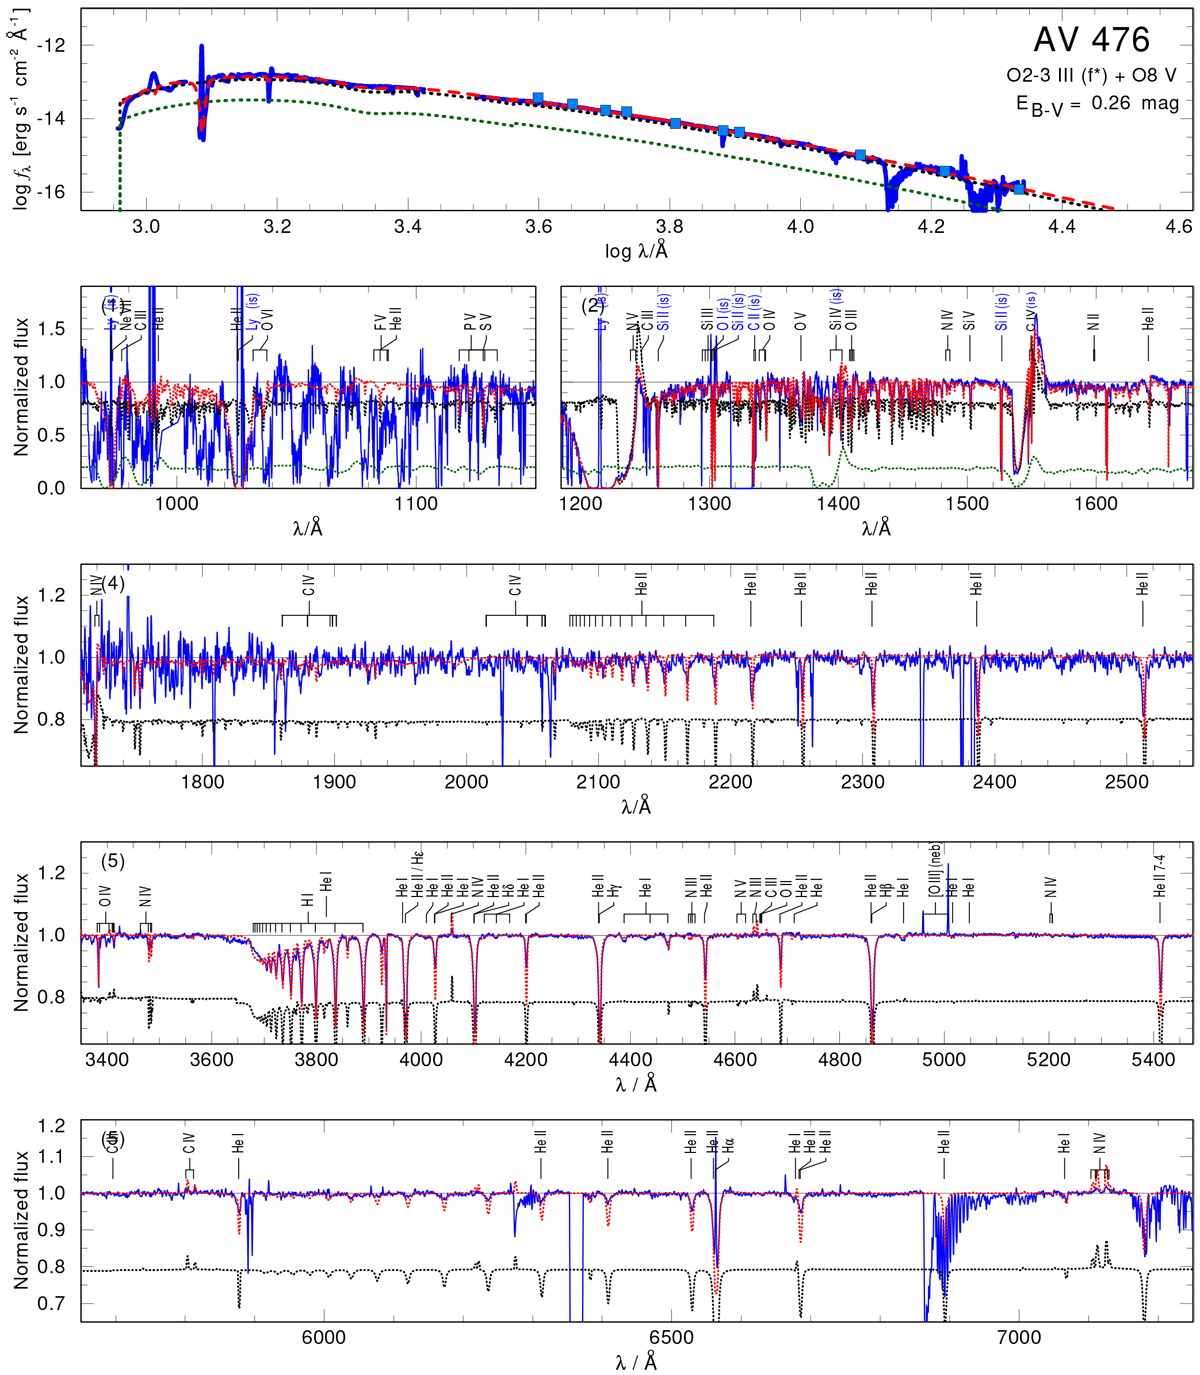
Fig. B.4
Download original image
Spectral model calculated with the stellar parameters of the most favored binary evolutionary model. The plots and line styles are the same as in Figs. 9 and 10. In this plot we use a distance of d = 49 kpc to compensate the used lower luminosities of the binary components. This plot demonstrates that the predicted surface abundances of the binary evolutionary models are unable to reproduce the observed spectrum. The nitrogen abundance in this model is too strong as it overestimates all optical N IV lines and also predicts unseen N V absorption. The reduced hydrogen abundance leads to an increased helium abundance. This enrichment would produce too deep He II lines in the spectrum of the primary.
Current usage metrics show cumulative count of Article Views (full-text article views including HTML views, PDF and ePub downloads, according to the available data) and Abstracts Views on Vision4Press platform.
Data correspond to usage on the plateform after 2015. The current usage metrics is available 48-96 hours after online publication and is updated daily on week days.
Initial download of the metrics may take a while.