Fig. 12
Download original image
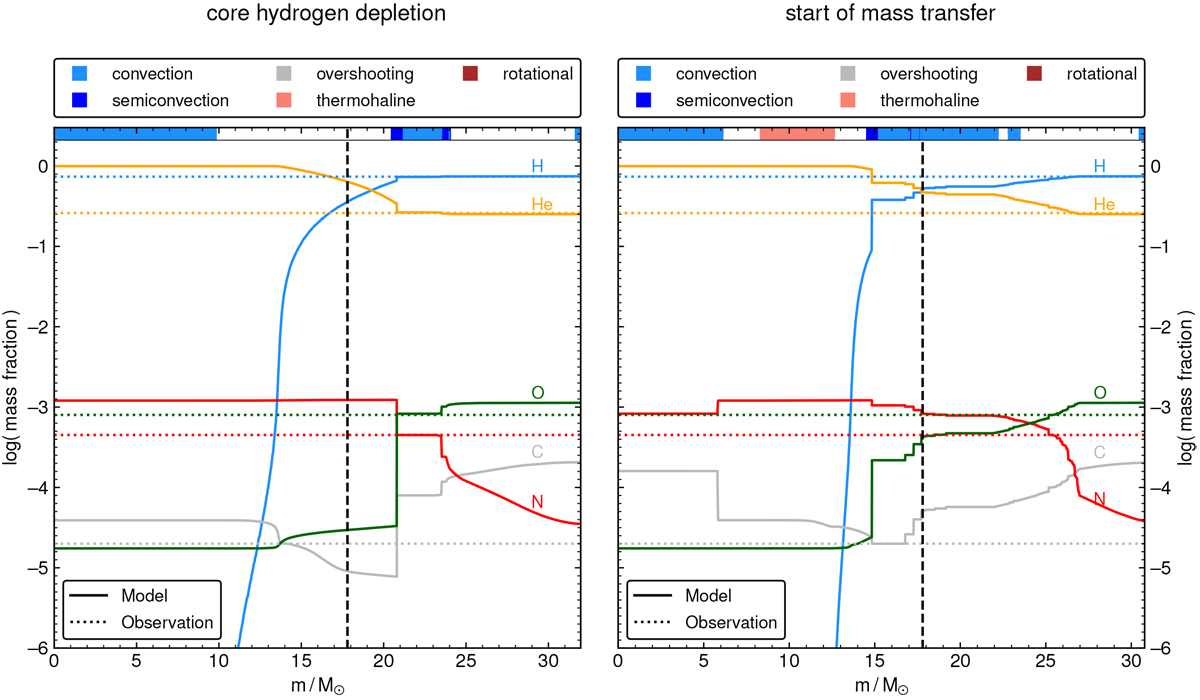
Abundance profiles of the primary at different evolutionary stages as predicted by the evolutionary models. The legend at the top of each plot explains the colors indicating the dominating mixing processes. The H, He, C, N, and O abundances of the model are shown as solid lines while the observed surface CNO abundances are shown as dotted lines of the same respective color. The vertical black dotted line indicates the mass of the primary after mass transfer. Left panel: primary has depleted hydrogen in the core and is at the terminal age MS. Right panel: primary fills its Roche lobe and starts transferring mass.
Current usage metrics show cumulative count of Article Views (full-text article views including HTML views, PDF and ePub downloads, according to the available data) and Abstracts Views on Vision4Press platform.
Data correspond to usage on the plateform after 2015. The current usage metrics is available 48-96 hours after online publication and is updated daily on week days.
Initial download of the metrics may take a while.