Fig. 11
Download original image
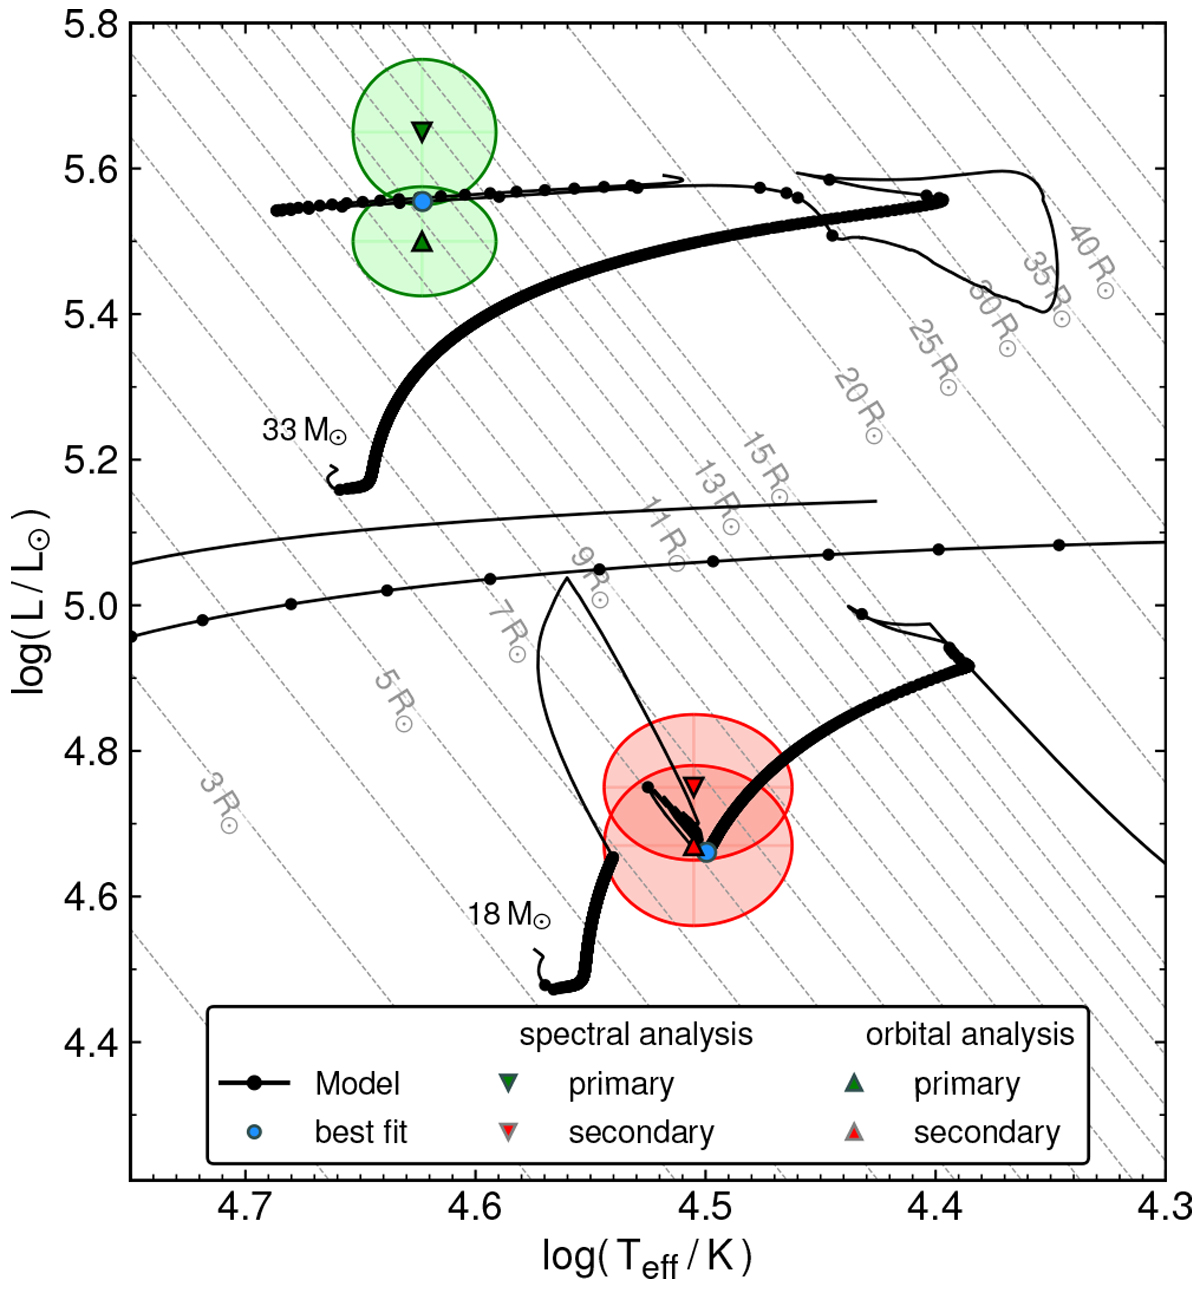
HRD showing the positions of each binary component according to the spectroscopic and orbital analysis, and the best fitting binary evolutionary tracks. The results of the spectroscopic analysis are shown as triangles and the orbital analysis as upside-down triangles. The positions of the primary and secondary are marked in green and red, respectively. The shaded areas indicate the respective error-ellipses. Evolutionary tracks (solid lines) of both binary componentsare according to the best fitting binary model calculated with MESA (see Sect. 5.2). The tracks are labeled by their initial masses. The black dots on the tracks correspond to equidistant time-steps of 0.1 Myr to emphasize the most probable observable phases. The light blue dots mark the best-fitting model.
Current usage metrics show cumulative count of Article Views (full-text article views including HTML views, PDF and ePub downloads, according to the available data) and Abstracts Views on Vision4Press platform.
Data correspond to usage on the plateform after 2015. The current usage metrics is available 48-96 hours after online publication and is updated daily on week days.
Initial download of the metrics may take a while.