Fig. 5.
Download original image
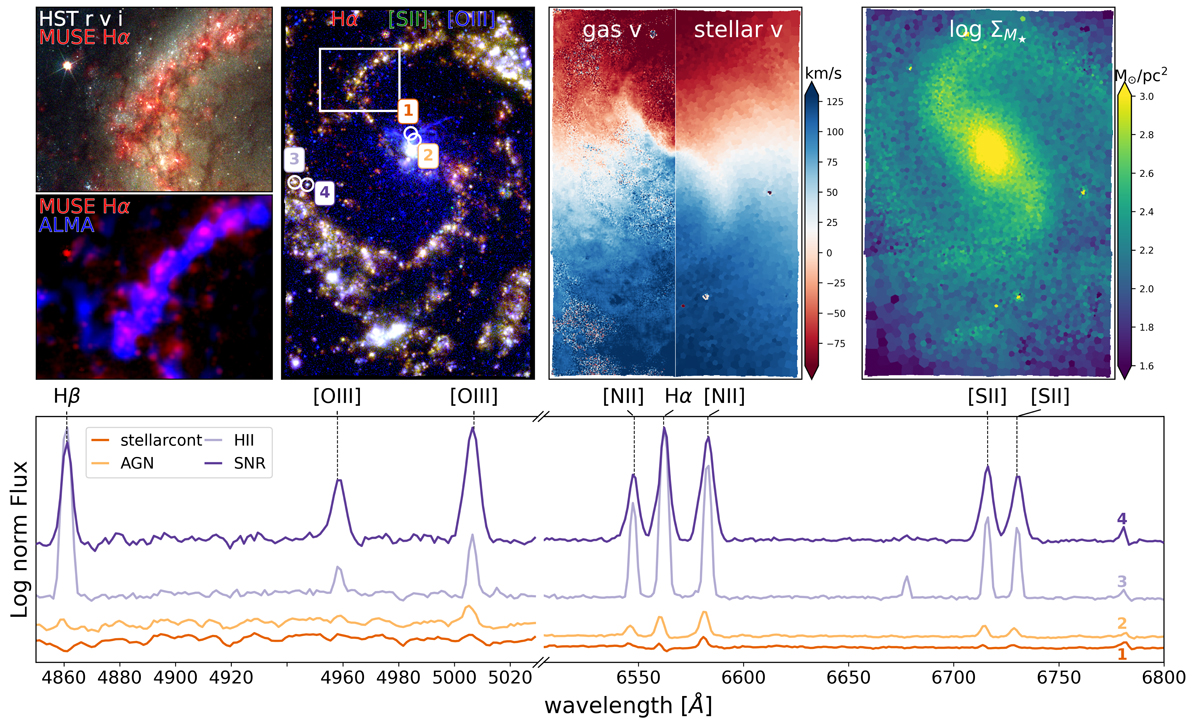
Multi-wavelength, multi-phase view of NGC 4535. The top panels present the stellar and gas distribution and kinematics. Top, second panel from the left: multi-emission line view (Hα in red, [O III] in blue, [S II] in green) tracing the sites of massive star formation along the spiral pattern, with differences in the combined colours highlighting the changes in local physical condition (e.g., abundance, ionisation parameter) and ionising source. Second panel from the left: extracted spectra (marked as white circles) demonstrating the typical characteristics of four (numbered) regions, namely: 1- dominated by stellar continuum (red); 2- AGN (orange); 3- H II regions (light purple), and 4- supernova remnants (SNR; purple). AGN line emission is superimposed on the strong stellar continuum absorption, with distinctive strong [O III] and [N II] emission. In the outer disc, H II regions and SNRs have less contribution from the stellar continuum. Broadened line shapes are apparent in the expanding SNR, in contrast to the narrower H II region line emission, and show strong [S II] and [N II] relative to Hα. Zooming into one section of the spiral arm (white box), spatial offsets between the HST star clusters and ionised gas (left top) and between the ionised gas and ALMA molecular gas (left bottom) demonstrate a time sequence evolution across the spiral pattern. Centre right: the gas and stellar velocity fields, mapped through the MUSE spectroscopy, highlight deviations from regular rotation and indicate dynamically driven radial flows along the spiral and bar structures. Right: the stellar mass surface density (ΣM⋆; see Sect. 5.2.4) highlights the location of these dynamical spiral and bar structures, and provides crucial constraints on the underlying gravitational potential affecting all stellar and gaseous processes in the disc.
Current usage metrics show cumulative count of Article Views (full-text article views including HTML views, PDF and ePub downloads, according to the available data) and Abstracts Views on Vision4Press platform.
Data correspond to usage on the plateform after 2015. The current usage metrics is available 48-96 hours after online publication and is updated daily on week days.
Initial download of the metrics may take a while.