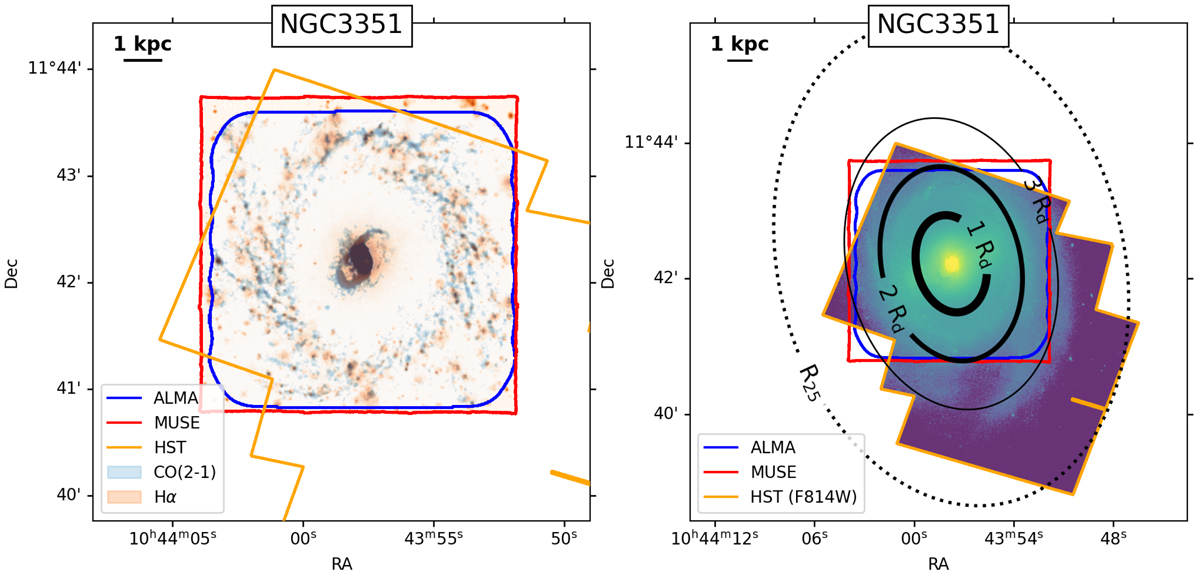
Fig. 4.
Download original image
Synoptic view of the PHANGS multi-wavelength data using NGC 3351 for illustration. Left: blue and red contours showing the footprints of the PHANGS-ALMA and PHANGS-MUSE data. Within the respective footprints, we show flux maps for Hα from MUSE (light red) and CO(2–1) from ALMA (light blue). The footprint of the HST observations included in the PHANGS-HST data release is also shown as an orange contour. Right: HST imaging (F814W filter) shown in colour. The image covers a larger FoV with respect to the left panel in order to show the entire area imaged by HST. We also indicate several radial metrics: the disc scale length (Rd, as derived in Leroy et al. 2021a) and R25. The ALMA and MUSE footprints are also shown, same as in the left panel. We note that all MUSE, ALMA, and HST footprints of the 19 galaxies can be found at https://archive.stsci.edu/hlsp/phangs-hst.
Current usage metrics show cumulative count of Article Views (full-text article views including HTML views, PDF and ePub downloads, according to the available data) and Abstracts Views on Vision4Press platform.
Data correspond to usage on the plateform after 2015. The current usage metrics is available 48-96 hours after online publication and is updated daily on week days.
Initial download of the metrics may take a while.