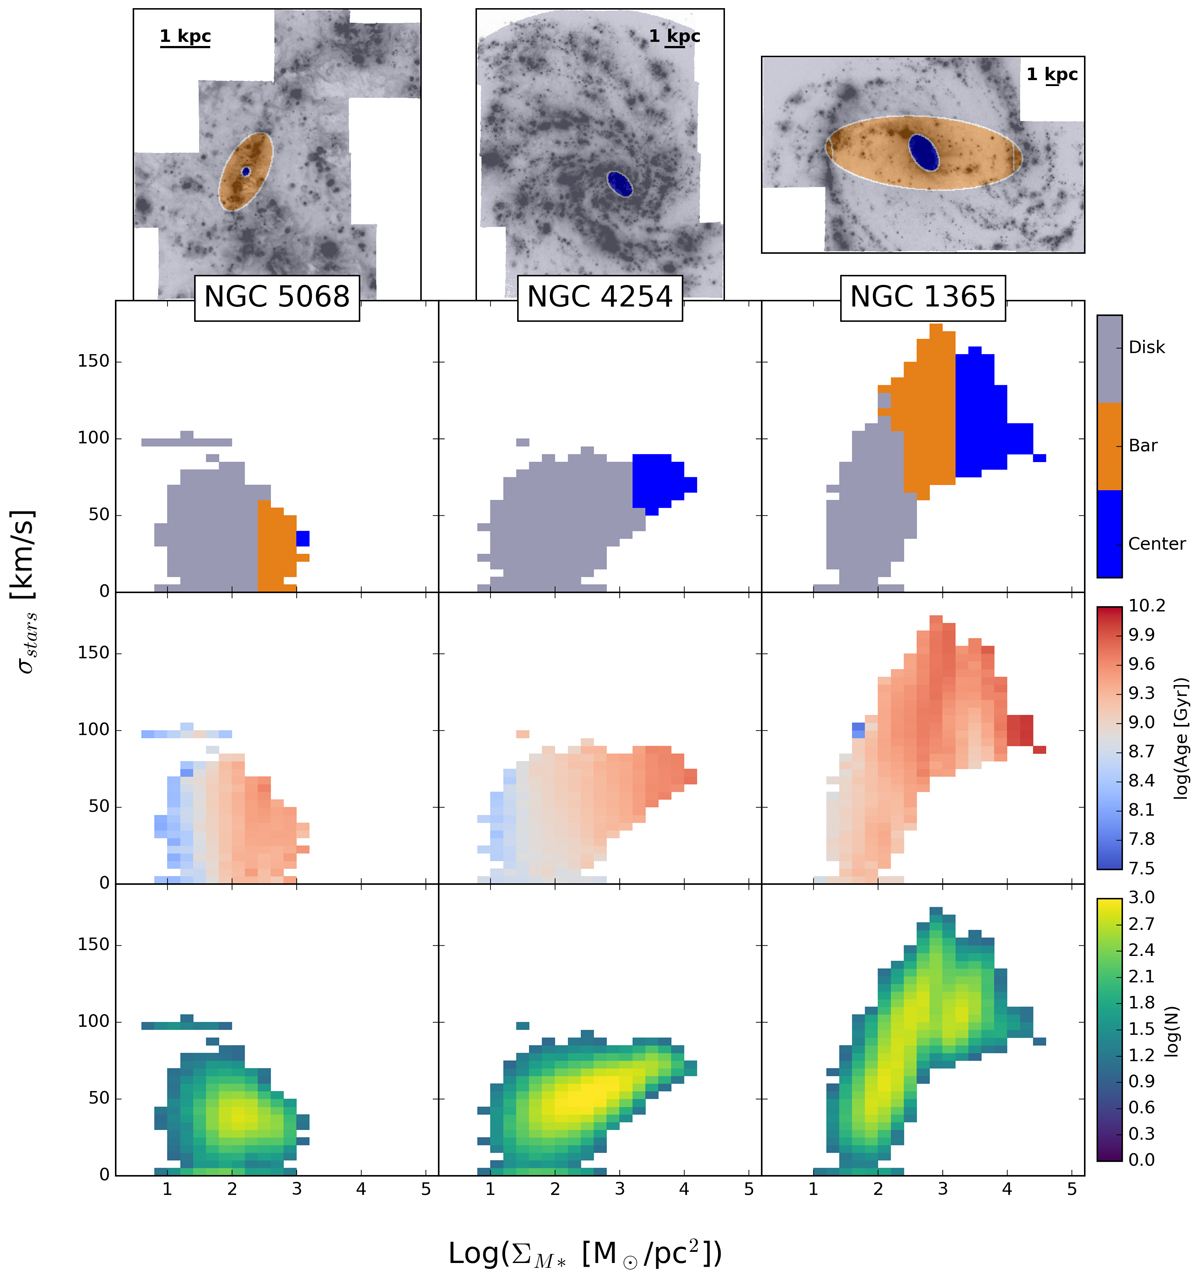
Fig. 28.
Download original image
Changes in stellar velocity dispersion reflected by their dynamical environment. These three galaxies represent galaxies at the lowest stellar mass (NGC 5068), an average stellar mass flocculent morphology (NGC 4254), and the highest stellar mass, AGN-dominated, strongly barred morphology (NGC 1365). Top: each galaxy broken down into its centre (blue), bar (orange), and disc (grey) environments from Querejeta et al. (2021). Bottom: distribution of values from the individual Voronoi bins plotted (see Sect. 5.1), comparing the stellar velocity dispersion (σstars) to the stellar mass surface density (ΣM⋆). We further colour-code each part of the histogram by the environment (second row), the median luminosity-weighted stellar age (third row), or the number density (fourth row). The disc-dominated galaxies (NGC 5068 and NGC 4254) show moderate σstars with an increase at high ΣM⋆, corresponding to the central environment, and younger stellar ages at lower ΣM⋆ (in the spiral arm and outer disc). NGC 1365 presents a more complicated star-formation history, with older stellar ages dominating across the bar associated with increased stellar dispersions. In this set of figures, we see how our PHANGS-MUSE data allow us to trace the individual impact of the galactic potential on the stars, as well as perturbations from non-axisymmetry (e.g., bar and spiral structures) in the disc.
Current usage metrics show cumulative count of Article Views (full-text article views including HTML views, PDF and ePub downloads, according to the available data) and Abstracts Views on Vision4Press platform.
Data correspond to usage on the plateform after 2015. The current usage metrics is available 48-96 hours after online publication and is updated daily on week days.
Initial download of the metrics may take a while.