Fig. 26.
Download original image
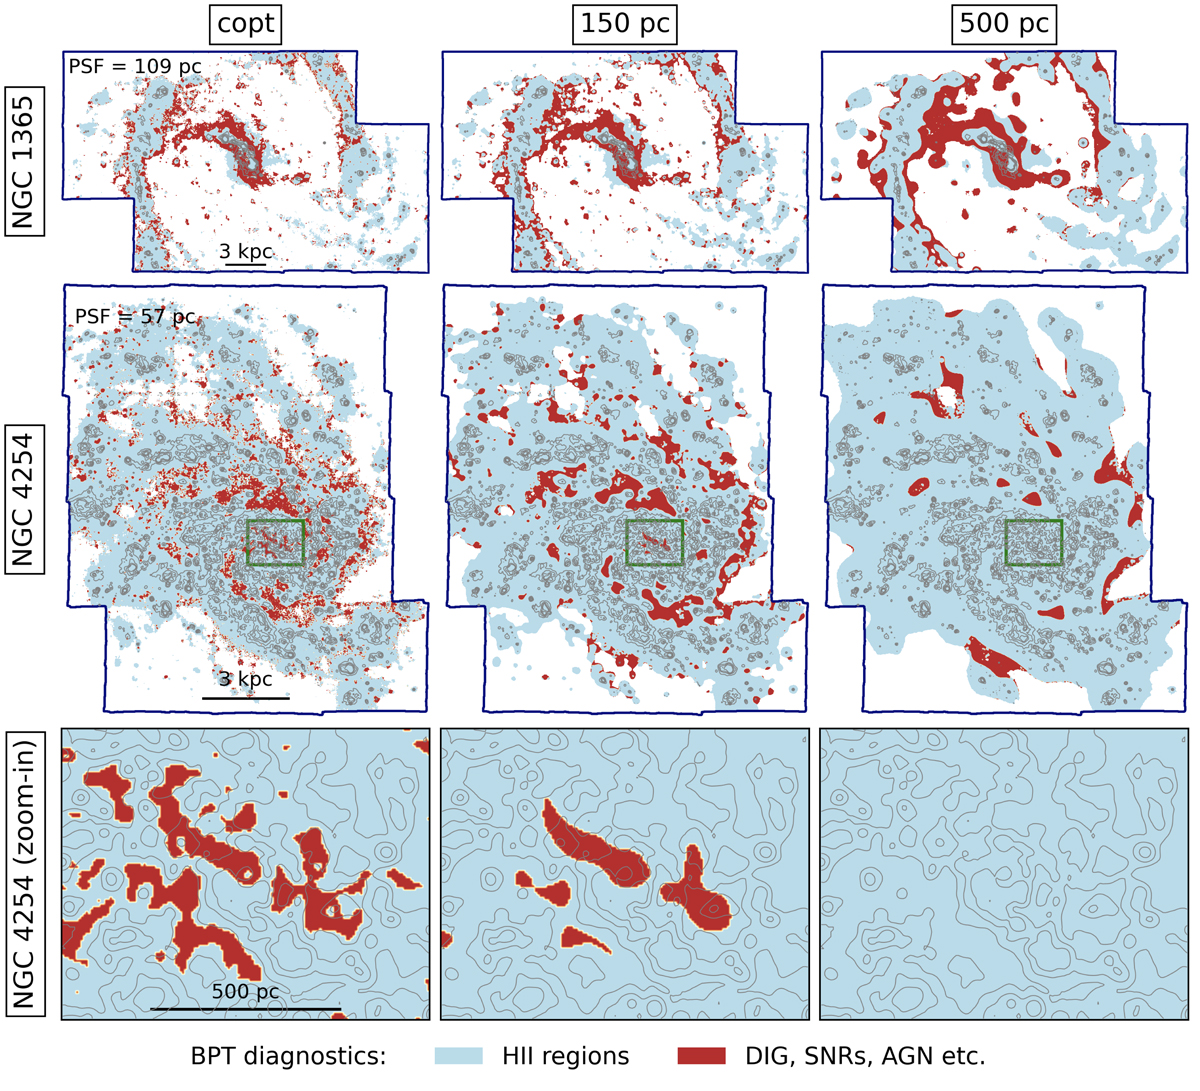
Mapping how the pixel-based BPT classifications change as a function of physical resolution for NGC 1365 and NGC 4254. We convolve line maps of each target from copt resolution to 150 pc and 500 pc scales and apply the Kauffmann et al. (2003) [N II]/Hα demarcation to distinguish photoionisation (blue) from harder ionising sources (shocks and AGN, in red). At high spatial resolution, the DIG also displays line ratios consistent with such shock models (Belfiore et al. 2022). Hα contours at the copt resolution (left panels) are shown at each scale for reference. In NGC 4254, as we convolve to larger spatial scales we see that the luminosity weighting results in a larger area of the map appear consistent with photoionisation. This is more apparent in a zoomed-in view (bottom panel). Individual isolated sources with shock excitation (likely SNRs) and the imprint of the DIG are no longer distinguishable in such disc galaxies as we move to the largest 500 pc scales. In contrast, the strong, extended AGN contamination in NGC 1365 can still be recovered. These figures demonstrate the power of diagnostic line ratios in distinguishing ionisation sources, as well as the importance of high (< 150 pc resolution) imaging to obtain an accurate census of ionising sources in the disc.
Current usage metrics show cumulative count of Article Views (full-text article views including HTML views, PDF and ePub downloads, according to the available data) and Abstracts Views on Vision4Press platform.
Data correspond to usage on the plateform after 2015. The current usage metrics is available 48-96 hours after online publication and is updated daily on week days.
Initial download of the metrics may take a while.