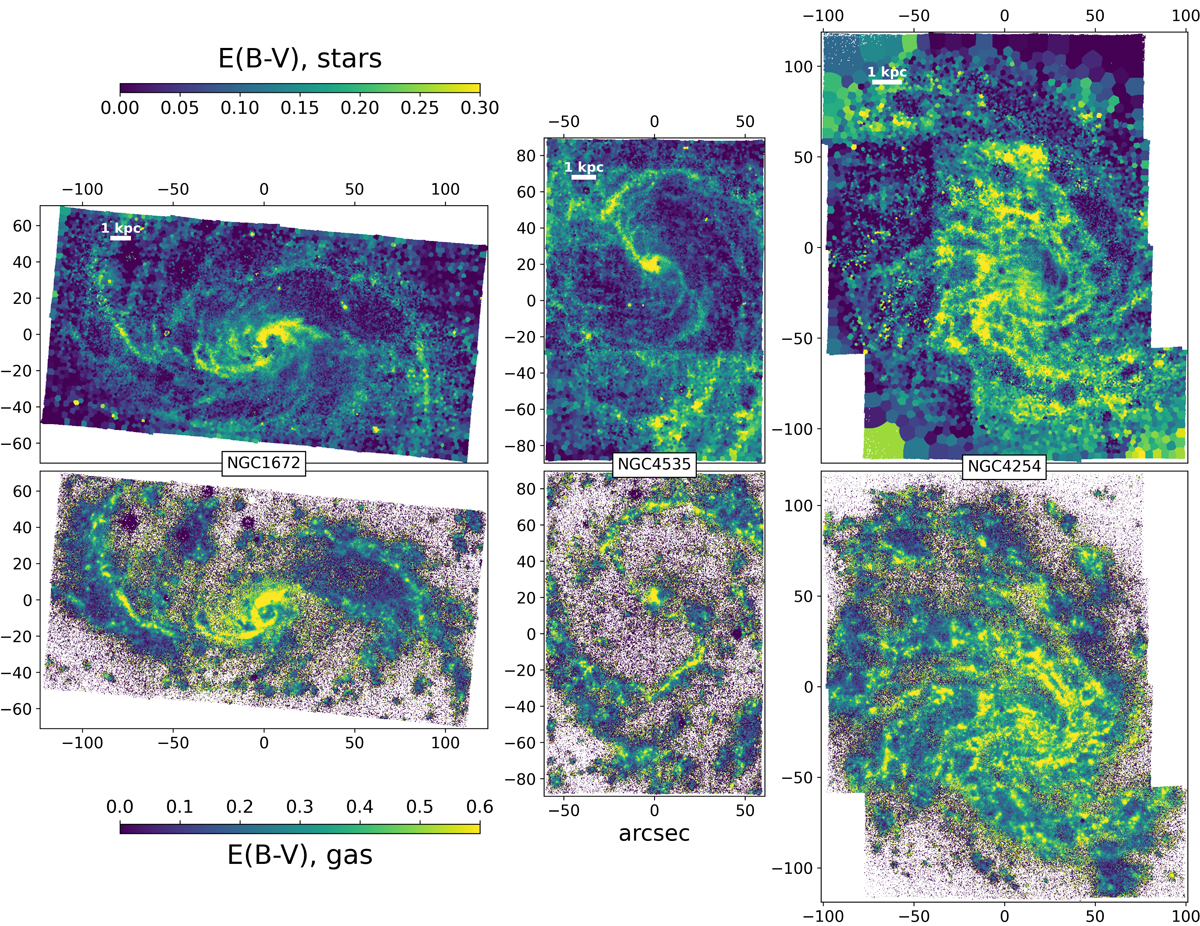
Fig. 23.

Download original image
Stellar and gas E(B − V) for three example galaxies. The stellar E(B − V)stars is determined from the Voronoi binned data cubes used for stellar population analysis, while the gas E(B − V)gas is computed from the Balmer decrement, derived from the spaxel-level analysis of the ionised gas emission lines (only regions with S/N > 4 in the line emission are considered). The colour bars for the gaseous E(B − V) is stretched by a factor of two to account for the average ratio E(B − V)stars ∼ 0.5 E(B − V)gas. E(B − V)stars traces similar structures as E(B − V)gas, although jumps are evident when comparing the average level of some MUSE pointings to that of their neighbours (e.g., the bottom-right pointing in NGC 4535 and the three left-most pointings in NGC 4254).
Current usage metrics show cumulative count of Article Views (full-text article views including HTML views, PDF and ePub downloads, according to the available data) and Abstracts Views on Vision4Press platform.
Data correspond to usage on the plateform after 2015. The current usage metrics is available 48-96 hours after online publication and is updated daily on week days.
Initial download of the metrics may take a while.


