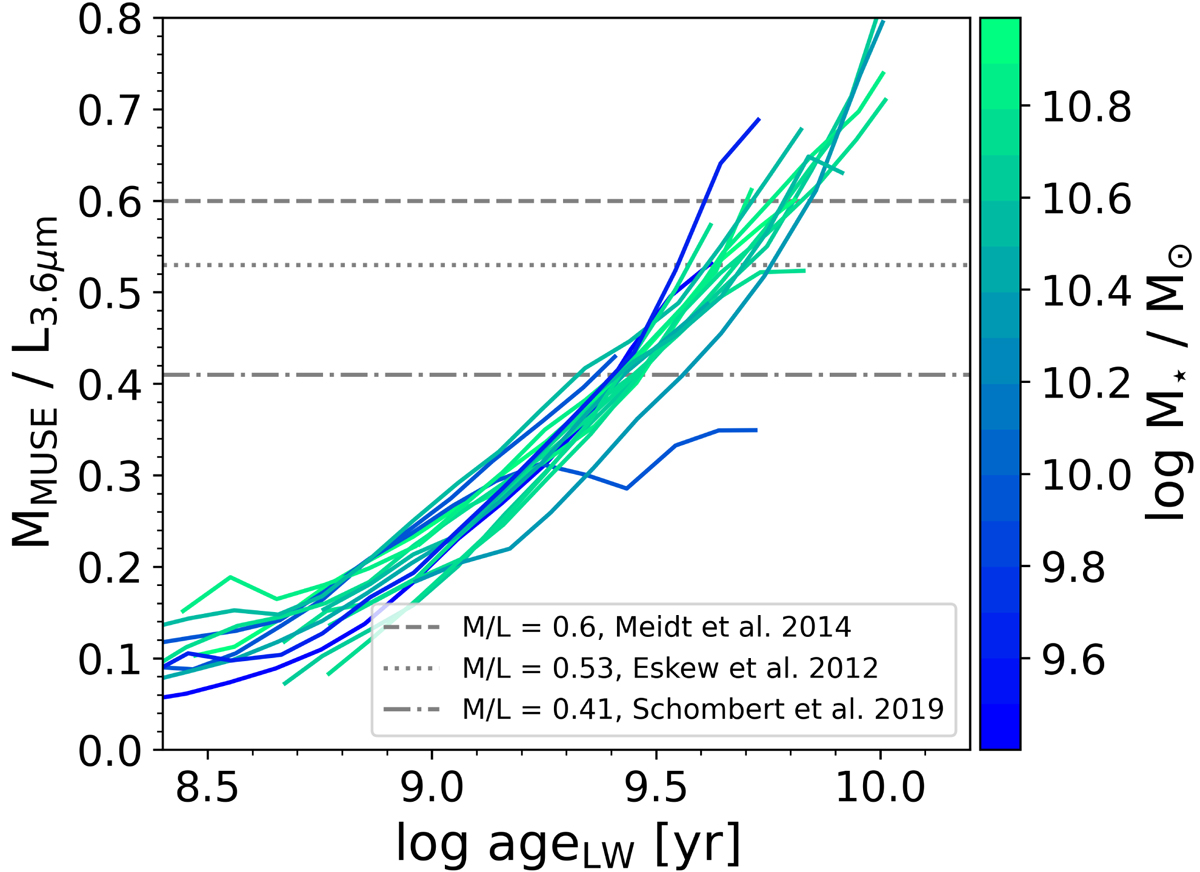
Fig. 22.
Download original image
Age dependence of the MMUSE/L3.6 μm ratio (in M⊙/L⊙) for the galaxies in our sample, where L3.6 μm corresponds to the luminosity of a pixel in the original IRAC 3.6 μm image (not the ICA version from S4G). Each line represents a galaxy, coloured by its total stellar mass. The figure shows a positive trend, with pixels hosting older stellar populations having larger M/L ratios. The horizontal lines mark different values adopted in the literature (dot-dashed line M/L = 0.41, Schombert et al. 2019; dotted line, M/L = 0.53, Eskew et al. 2012; dashed line M/L = 0.6, Meidt et al. 2014).
Current usage metrics show cumulative count of Article Views (full-text article views including HTML views, PDF and ePub downloads, according to the available data) and Abstracts Views on Vision4Press platform.
Data correspond to usage on the plateform after 2015. The current usage metrics is available 48-96 hours after online publication and is updated daily on week days.
Initial download of the metrics may take a while.