Fig. 21.
Download original image
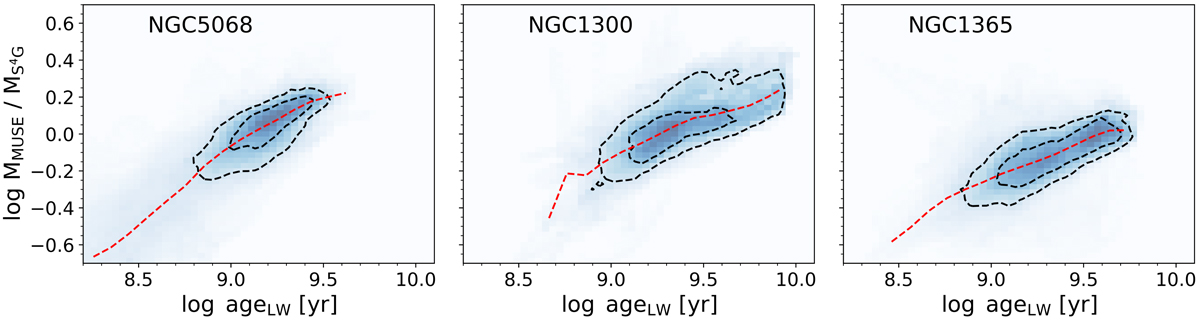
Two-dimensional histogram of the ratio between the stellar mass surface density derived from full spectral fitting from MUSE (Sect. 5.2.4) and archival stellar mass maps from S4G, based on Spitzer IRAC maps (Querejeta et al. 2015), as a function of the light-weighted age of the underlying stellar population in each pixel, derived from the full spectral fitting. We show three galaxies in our sample, spanning the stellar mass range of the PHANGS-MUSE sample (in ascending order from left to right). The figure shows good agreement between the MUSE and the S4G mass maps in pixels dominated by stellar populations older than ∼4 Gyr. However, in regions hosting younger populations, the masses derived from the near-IR data are systematically larger, possibly due to the contribution of AGB stars to the near-IR flux. The contours mark the iso-probability curves where the probability density drops below 40% and 10% of the maximum. The dashed red line shows the median mass ratio at a given luminosity-weighted age.
Current usage metrics show cumulative count of Article Views (full-text article views including HTML views, PDF and ePub downloads, according to the available data) and Abstracts Views on Vision4Press platform.
Data correspond to usage on the plateform after 2015. The current usage metrics is available 48-96 hours after online publication and is updated daily on week days.
Initial download of the metrics may take a while.