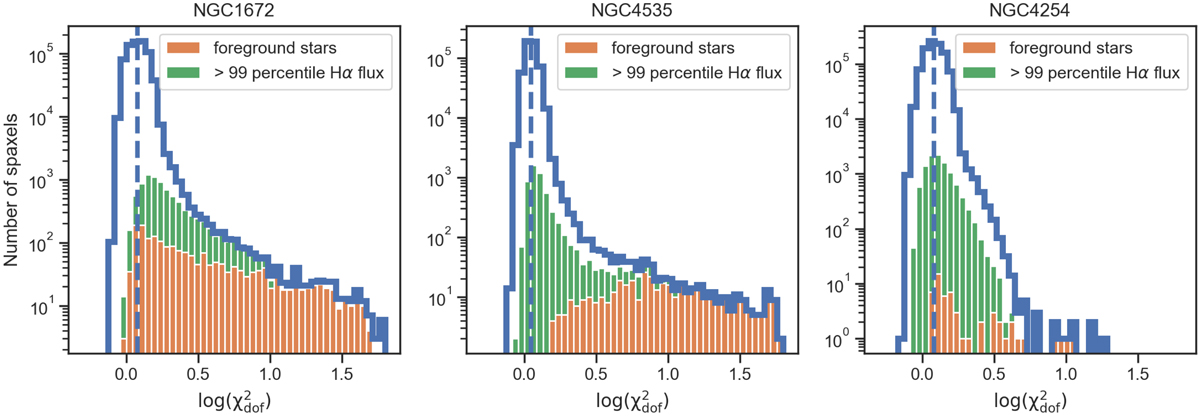
Fig. 19.
Download original image
Histogram of the distributions of ![]() (in blue) for the same example galaxies as in Fig. 18. The median
(in blue) for the same example galaxies as in Fig. 18. The median ![]() is shown as a blue vertical dashed line. We show as a bar plot in orange and green the stacked histograms of pixels belonging to our foreground star masks (orange) and to the brightest line-emitting regions (> 99th percentile of the Hα emission, in green). Because the bar plots are stacked, their sum must be smaller than the histogram of all spaxels in blue. This allows us to visually assess that the vast majority of high-
is shown as a blue vertical dashed line. We show as a bar plot in orange and green the stacked histograms of pixels belonging to our foreground star masks (orange) and to the brightest line-emitting regions (> 99th percentile of the Hα emission, in green). Because the bar plots are stacked, their sum must be smaller than the histogram of all spaxels in blue. This allows us to visually assess that the vast majority of high-![]() pixels are due to foreground stars and bright line-emitting regions.
pixels are due to foreground stars and bright line-emitting regions.
Current usage metrics show cumulative count of Article Views (full-text article views including HTML views, PDF and ePub downloads, according to the available data) and Abstracts Views on Vision4Press platform.
Data correspond to usage on the plateform after 2015. The current usage metrics is available 48-96 hours after online publication and is updated daily on week days.
Initial download of the metrics may take a while.