Fig. 18.
Download original image
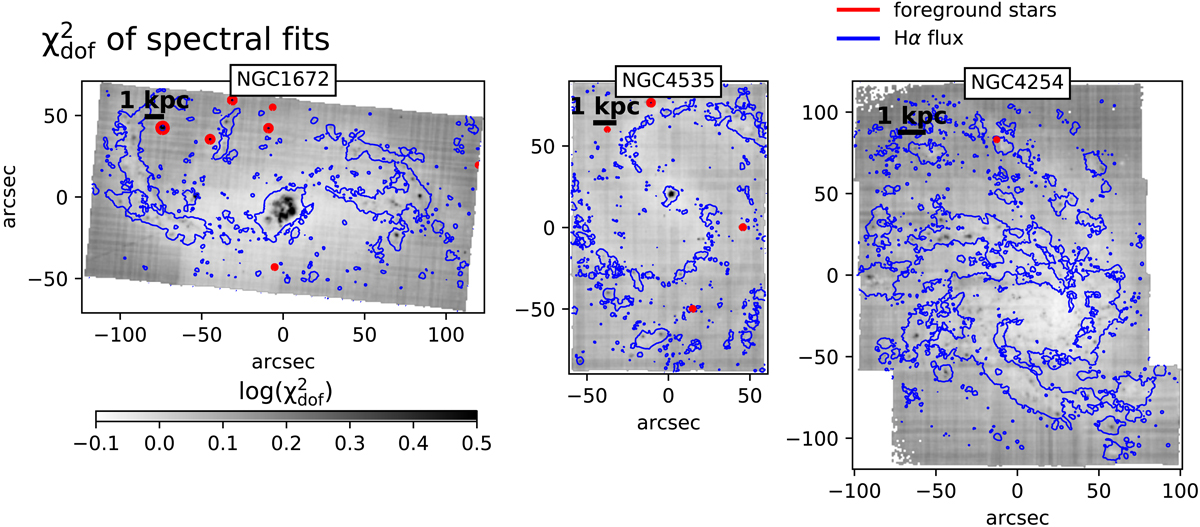
Maps of the ![]() for three example galaxies at the individual spaxel level. We show in blue contours the Hα surface brightness and in red the regions masked as foreground stars. The
for three example galaxies at the individual spaxel level. We show in blue contours the Hα surface brightness and in red the regions masked as foreground stars. The ![]() maps demonstrate the quality of our spectral fits
maps demonstrate the quality of our spectral fits ![]() , except in a few regions of bright Hα emission (e.g., the central regions in NGC 1672 and NGC 4535). A few regions of higher
, except in a few regions of bright Hα emission (e.g., the central regions in NGC 1672 and NGC 4535). A few regions of higher ![]() can also be seen in the middle of spiral arms, corresponding to the centres of bright H II regions. Foreground stars appear as small spots of very high
can also be seen in the middle of spiral arms, corresponding to the centres of bright H II regions. Foreground stars appear as small spots of very high ![]() and are emphasised with red contours.
and are emphasised with red contours.
Current usage metrics show cumulative count of Article Views (full-text article views including HTML views, PDF and ePub downloads, according to the available data) and Abstracts Views on Vision4Press platform.
Data correspond to usage on the plateform after 2015. The current usage metrics is available 48-96 hours after online publication and is updated daily on week days.
Initial download of the metrics may take a while.