Fig. 17.
Download original image
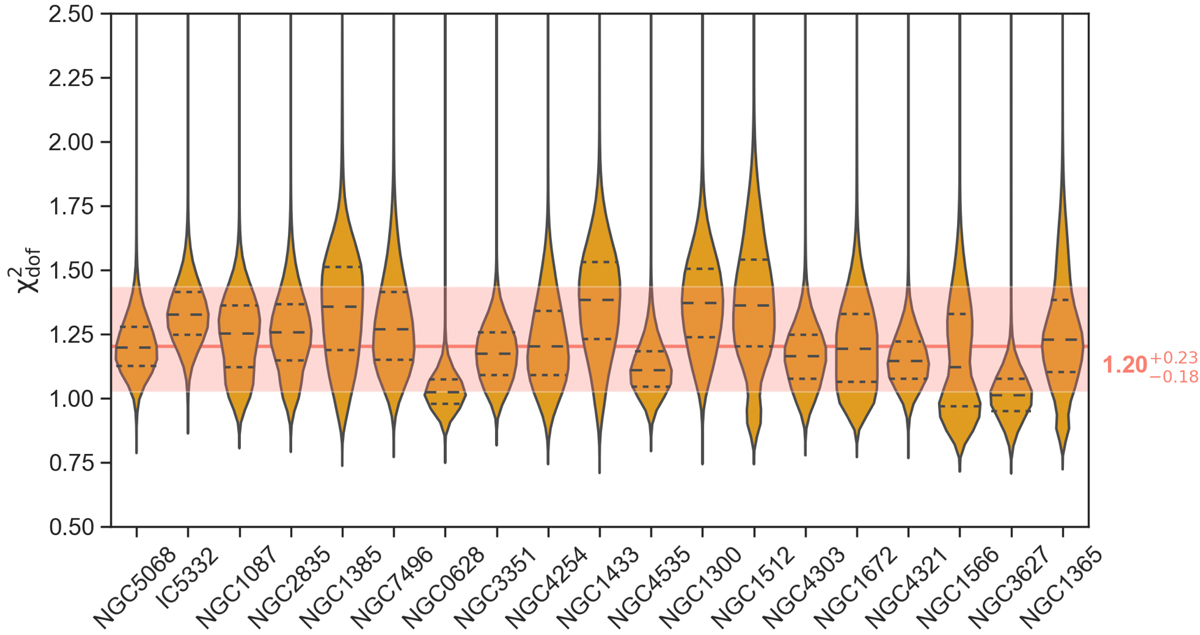
Histograms of the distributions of reduced chi-square, ![]() , of the resulting spectral fits for all the spaxels in all the galaxies in our sample. The reduced χ2 is calculated over the wavelength range fitted by the DAP (4850−7000 Å). The red horizontal line and shaded area corresponds to the median (16th and 84th) percentiles of the distribution across all galaxies, corresponding to
, of the resulting spectral fits for all the spaxels in all the galaxies in our sample. The reduced χ2 is calculated over the wavelength range fitted by the DAP (4850−7000 Å). The red horizontal line and shaded area corresponds to the median (16th and 84th) percentiles of the distribution across all galaxies, corresponding to ![]() .
.
Current usage metrics show cumulative count of Article Views (full-text article views including HTML views, PDF and ePub downloads, according to the available data) and Abstracts Views on Vision4Press platform.
Data correspond to usage on the plateform after 2015. The current usage metrics is available 48-96 hours after online publication and is updated daily on week days.
Initial download of the metrics may take a while.