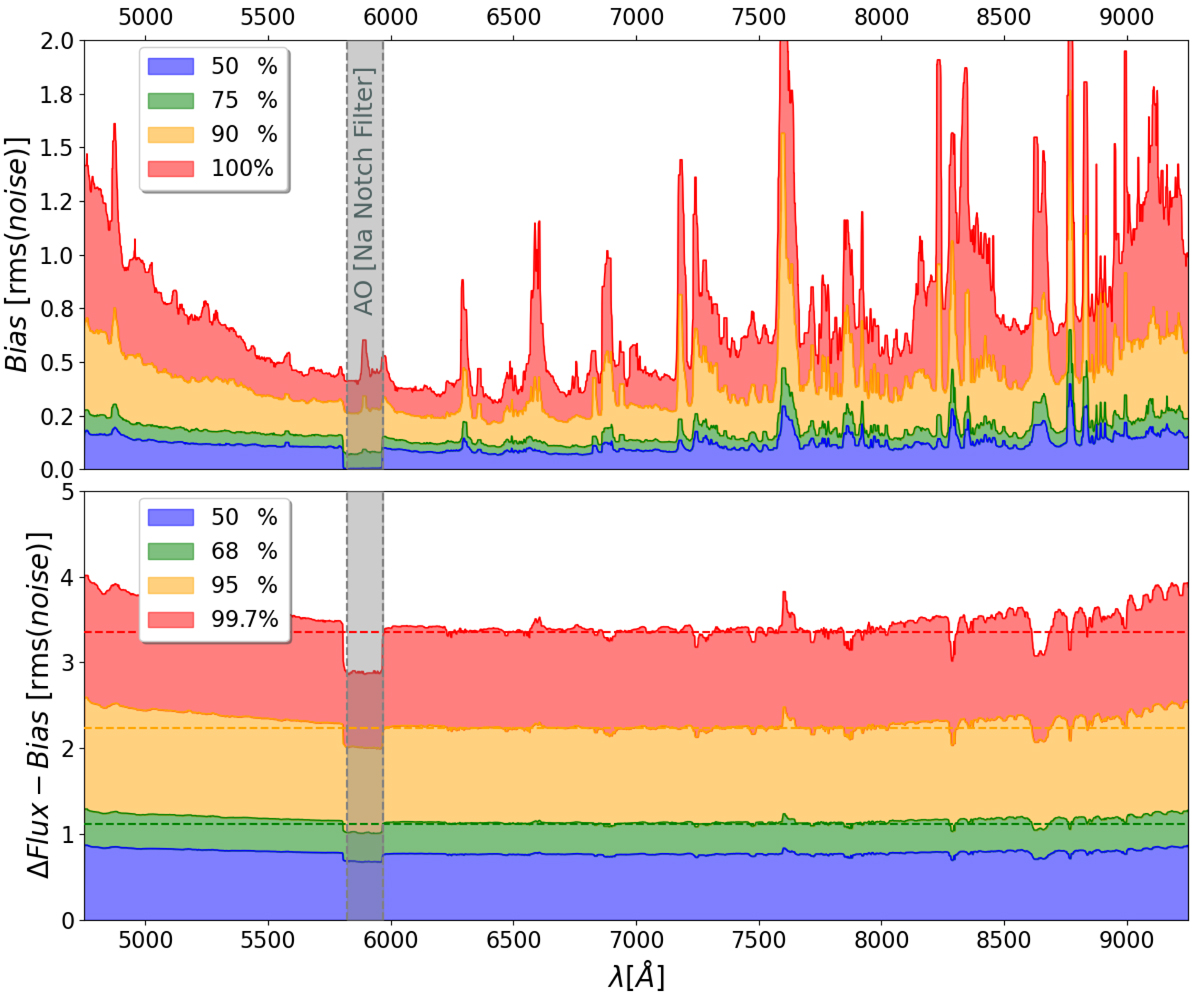
Fig. 16.
Download original image
Median offset and percentiles of the difference between spectra of the same regions from overlapping pointings. The statistics have been computed from a set of 249 regions covering the full PHANGS-MUSE sample, and the resulting percentile vectors have been filtered to make it legible (keeping the sky line residuals visible). Top panel: percentiles of the distribution of the bias level, normalised by the typical (overlap-region-averaged) noise level. Ninety percent of the spectra have a normalised bias that is typically between 30 and 50% of the noise level, while a small fraction show up at levels of 60−120% of the noise, specifically in the blue or red part of the spectrum. We note that although beyond 7000 Å residuals are heavily contaminated by sky line residuals, the pipeline still constructs a roughly correct noise vector. Bottom panel: percentiles (50, 68.3, 95.5%, and 99.7%) of the distribution of differences normalised by the individual spectra noise level, after subtraction of a wavelength-independent median bias offset (see text). The dashed (respectively, green, yellow, and red) lines show values of 1.12 (12% above 1), 2.24, and 3.36, showing that the noise level is slightly underestimated (by about 12%). A trend is visible towards the redder and bluer end of the wavelength coverage.
Current usage metrics show cumulative count of Article Views (full-text article views including HTML views, PDF and ePub downloads, according to the available data) and Abstracts Views on Vision4Press platform.
Data correspond to usage on the plateform after 2015. The current usage metrics is available 48-96 hours after online publication and is updated daily on week days.
Initial download of the metrics may take a while.