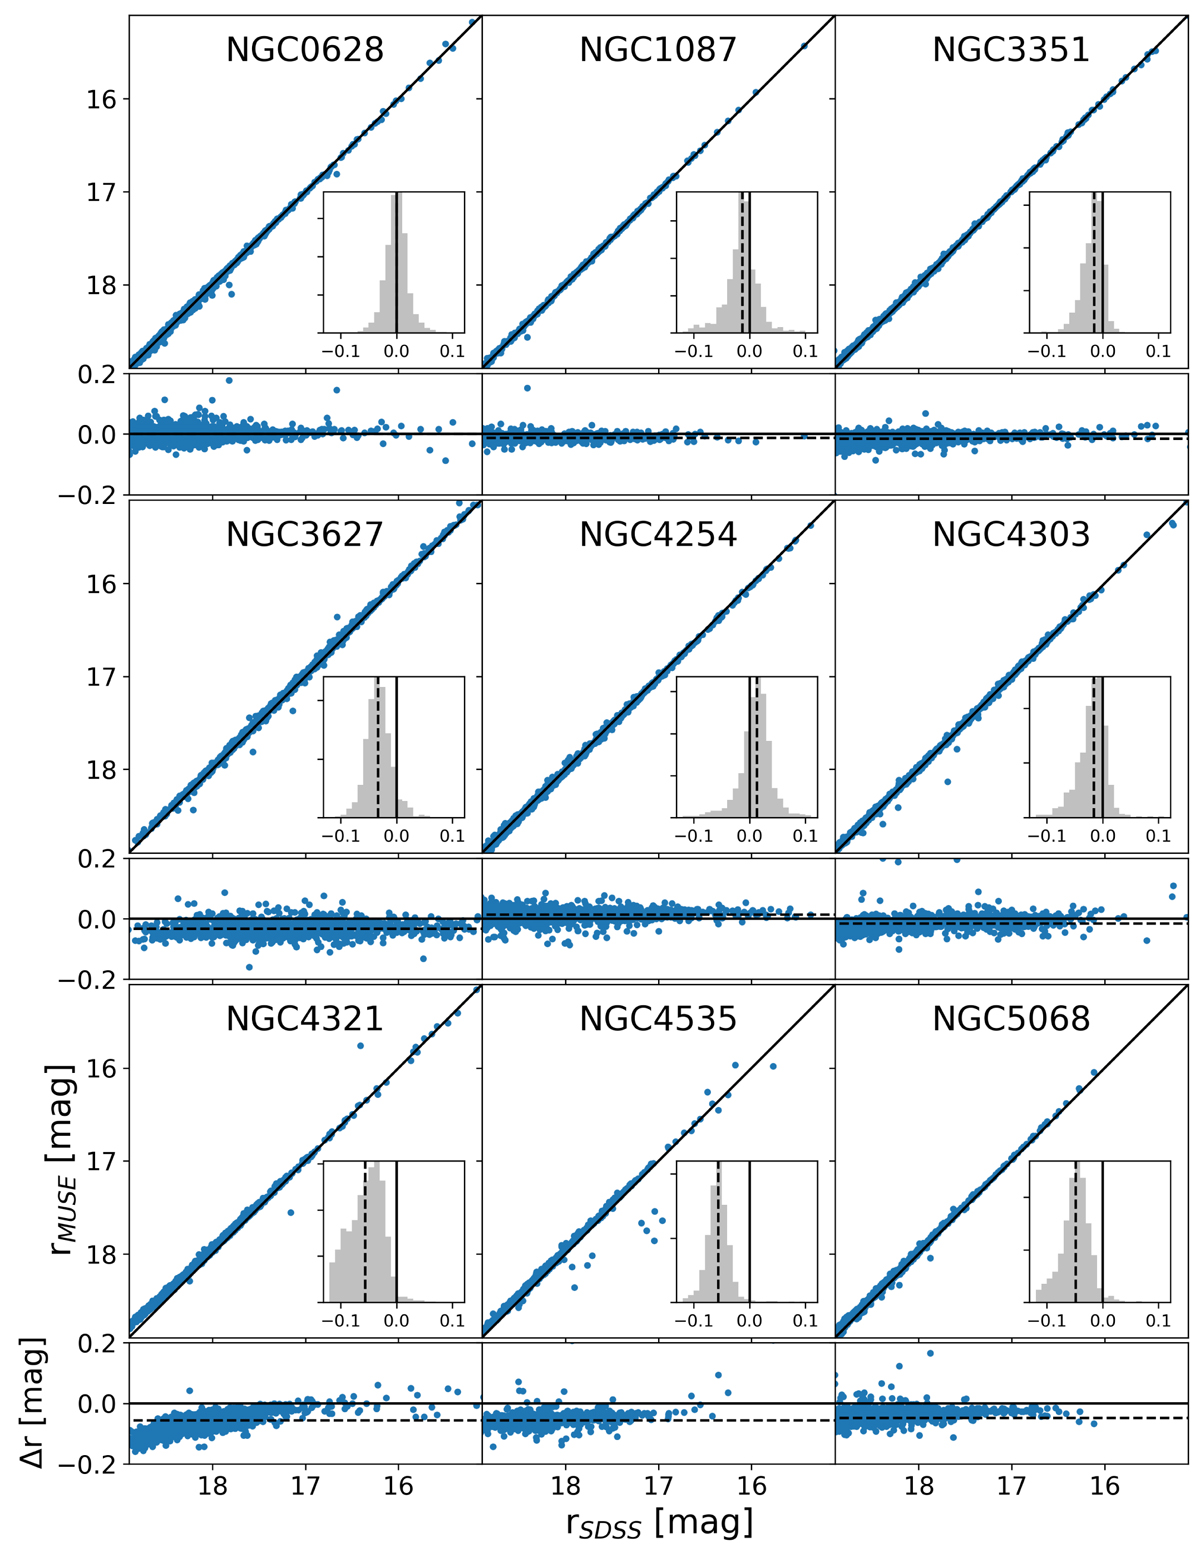
Fig. 15.
Download original image
Comparison of r-band magnitudes measured over 5″ × 5″ apertures within MUSE synthetic images (rMUSE) and SDSS images (rSDSS) for the nine galaxies with SDSS imaging available. Each panel is separated into a main one-to-one comparison plot and an additional plot below showing the magnitude difference (ΔrMUSE − SDSS) versus the SDSS value. Insets in each panel show the histograms of the magnitude difference, with the median offset indicated with a dashed line. Solid lines indicate the identity line (or the 0 value for the magnitude difference). Across this sample of galaxies, the median offset ranges from −0.06 to 0.01 mag. Typical scatter within any galaxy is ∼0.04 mag.
Current usage metrics show cumulative count of Article Views (full-text article views including HTML views, PDF and ePub downloads, according to the available data) and Abstracts Views on Vision4Press platform.
Data correspond to usage on the plateform after 2015. The current usage metrics is available 48-96 hours after online publication and is updated daily on week days.
Initial download of the metrics may take a while.