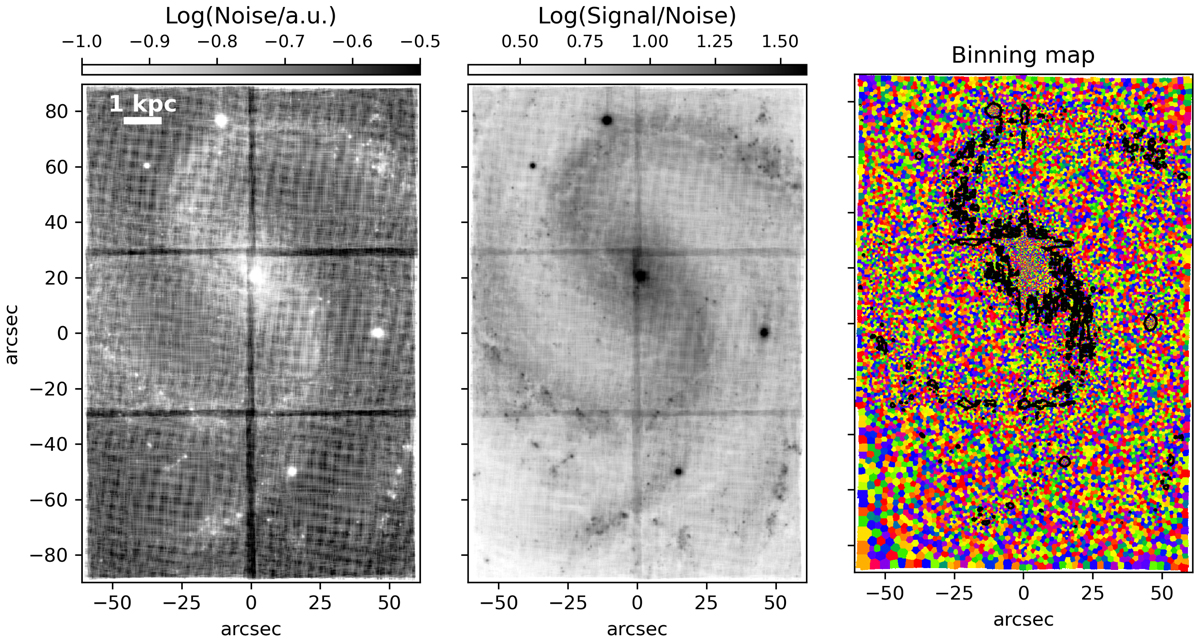
Fig. 12.
Download original image
Maps of the average noise (left panel), S/N (middle panel), and binning map (right panel) for NGC 4535. The noise and S/N maps are computed by averaging the pipeline noise and flux over the 5300−5500 Å wavelength range. The stripes dividing the surveyed area into six squared subregions correspond to the overlap regions of the six MUSE pointings obtained for this galaxy. The noise map also shows an evident cross-hatch pattern within individual pointings due to the cube-generating resampling step in the MUSE DRP when combining exposures with different rotation angles. This behaviour is also visible in the S/N map but does not significantly affect the results of the binning process. The binning map shows the result of the Voronoi binning procedure with target S/N = 35. The black contour shows the S/N = 12 level on individual spaxels. In this target only the galaxy centre (and a few foreground stars) have S/N > 35 in individual spaxels, which are therefore left unbinned.
Current usage metrics show cumulative count of Article Views (full-text article views including HTML views, PDF and ePub downloads, according to the available data) and Abstracts Views on Vision4Press platform.
Data correspond to usage on the plateform after 2015. The current usage metrics is available 48-96 hours after online publication and is updated daily on week days.
Initial download of the metrics may take a while.