Fig. 9.
Download original image
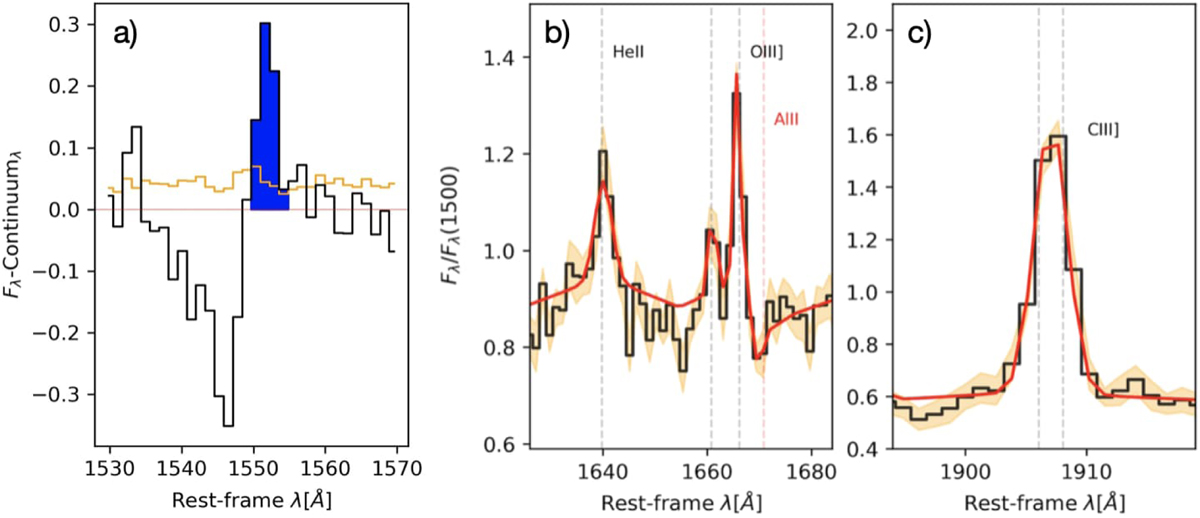
Emission-line flux and EW measurements in the stack by EW(Lyα) > 20. Panel a: continuum-subtracted spectrum. The orange line shows the error spectrum (1σ). The blue shaded region are the pixel integrated for the CIV line. Panels b and c: red line is the slinefit fitting for the spectrum. The orange shaded region shows 1σ uncertainty of the stacked spectrum.
Current usage metrics show cumulative count of Article Views (full-text article views including HTML views, PDF and ePub downloads, according to the available data) and Abstracts Views on Vision4Press platform.
Data correspond to usage on the plateform after 2015. The current usage metrics is available 48-96 hours after online publication and is updated daily on week days.
Initial download of the metrics may take a while.