Fig. C.2.
Download original image
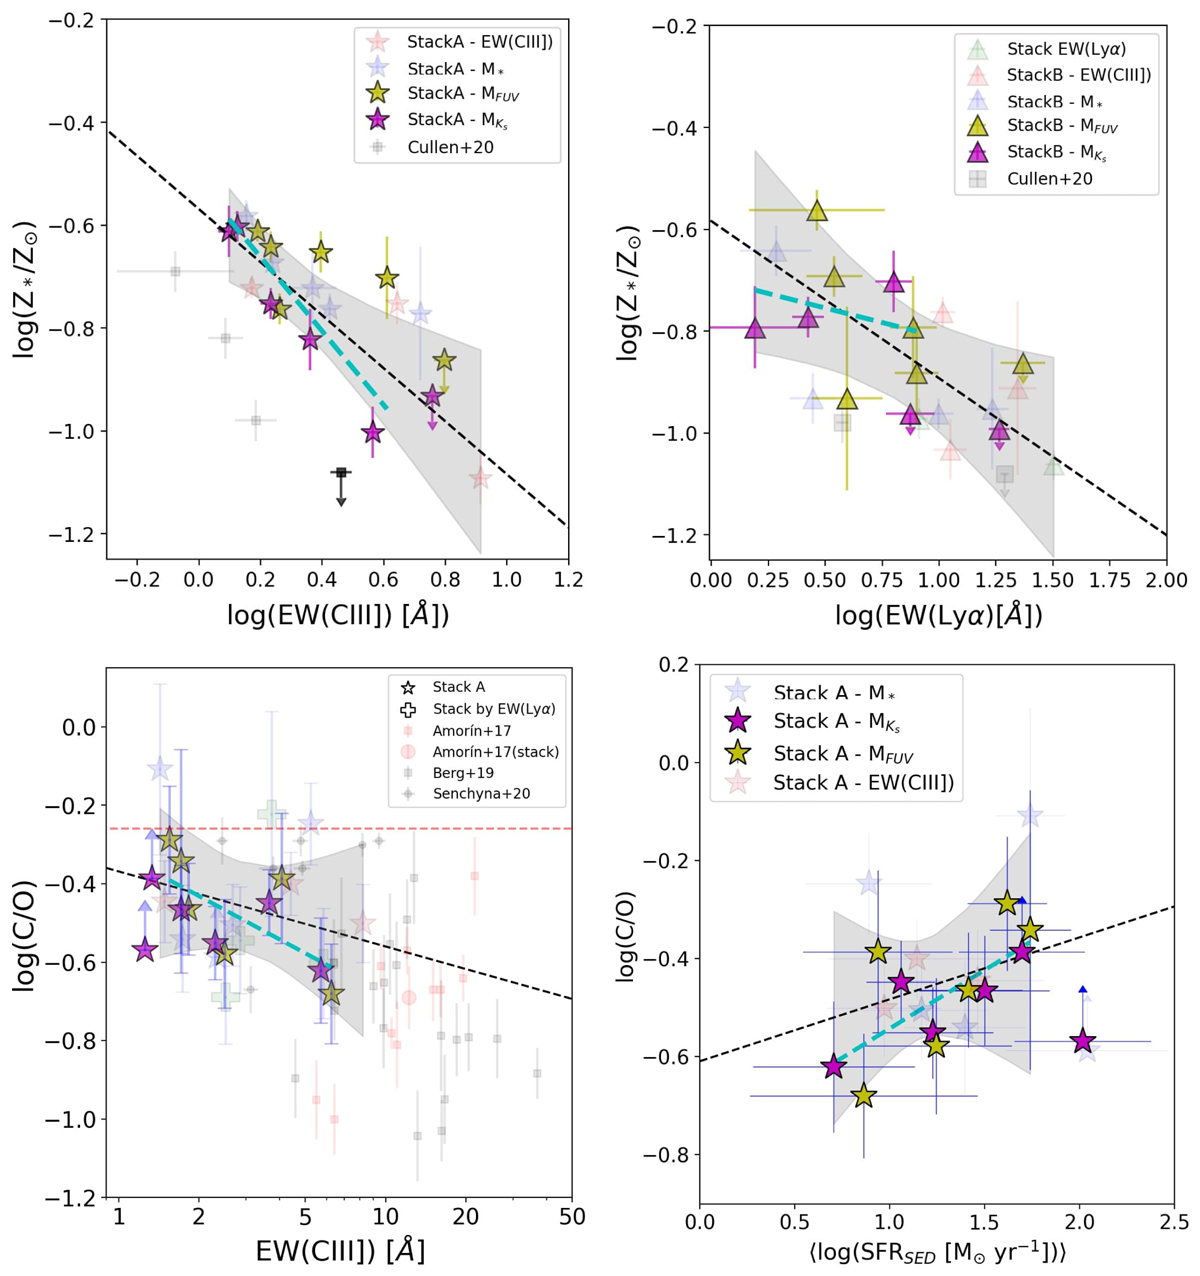
Changes in linear fit in relations presented in Figs. 14, 15, 16, and 18, considering only stacks based on luminosities. Symbols are the same as in Figs. 14, 15, 16, and 18, respectively. The cyan dashed line shows the best fit including only the A stacks binned by luminosity. The stacks excluded in the fit are shown using transparent symbols.
Current usage metrics show cumulative count of Article Views (full-text article views including HTML views, PDF and ePub downloads, according to the available data) and Abstracts Views on Vision4Press platform.
Data correspond to usage on the plateform after 2015. The current usage metrics is available 48-96 hours after online publication and is updated daily on week days.
Initial download of the metrics may take a while.