Fig. C.1.
Download original image
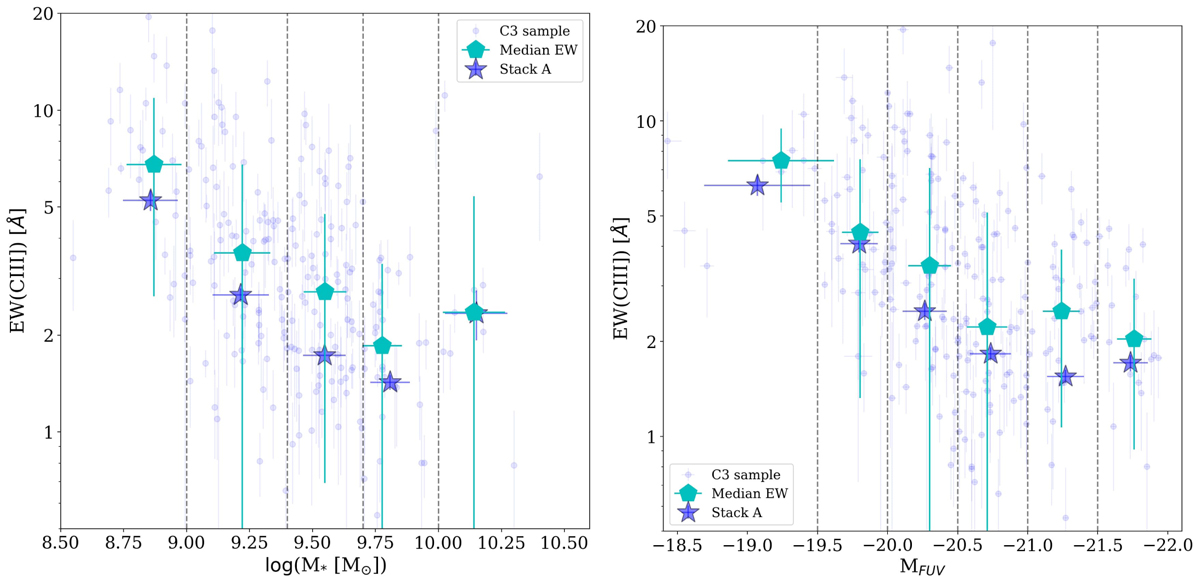
Relation between EW(CIII]) and stellar mass (left panel) and FUV (right panel) luminosity, similar as shown in Fig. 10 for stack A (blue stars) and C3 sample (small blue circles). The cyan pentagons are the median values for the individual galaxies in the bin and their errorbars correspond to the standard deviation in the bin (boundaries marked by vertical dashed line).
Current usage metrics show cumulative count of Article Views (full-text article views including HTML views, PDF and ePub downloads, according to the available data) and Abstracts Views on Vision4Press platform.
Data correspond to usage on the plateform after 2015. The current usage metrics is available 48-96 hours after online publication and is updated daily on week days.
Initial download of the metrics may take a while.