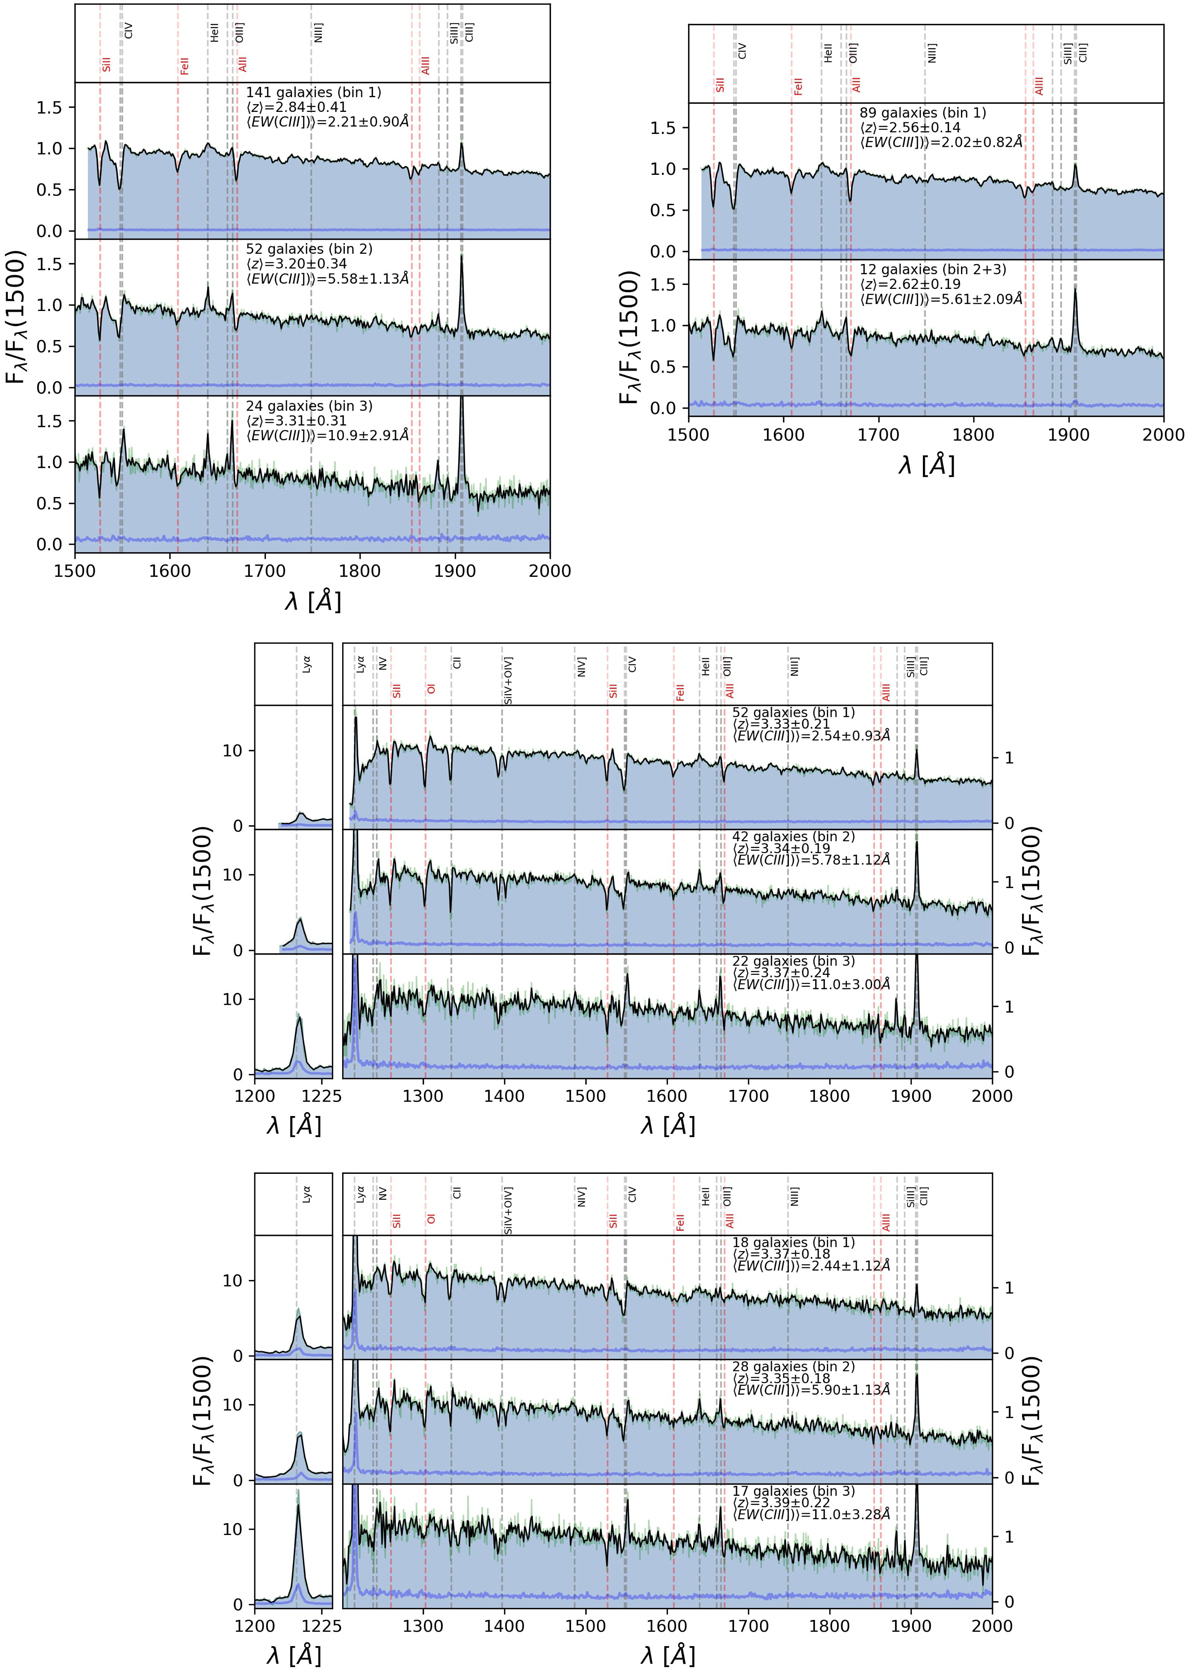
Fig. B.4.
Download original image
Stacks by EW(CIII]). Left to the right on top row: Stack A, Stack D. Middle row: Stack B. Bottom row: Stack C. In each panel, the green faint line is the stack spectrum with the ∼0.6 Å/pixel sampling, while the black one is with ∼1.2 Å/pixel. The blue line in the 1-σ error spectrum. The vertical lines mark known UV lines. Information about the number of galaxies, the mean redshift and the mean parameter are included in each panel.
Current usage metrics show cumulative count of Article Views (full-text article views including HTML views, PDF and ePub downloads, according to the available data) and Abstracts Views on Vision4Press platform.
Data correspond to usage on the plateform after 2015. The current usage metrics is available 48-96 hours after online publication and is updated daily on week days.
Initial download of the metrics may take a while.