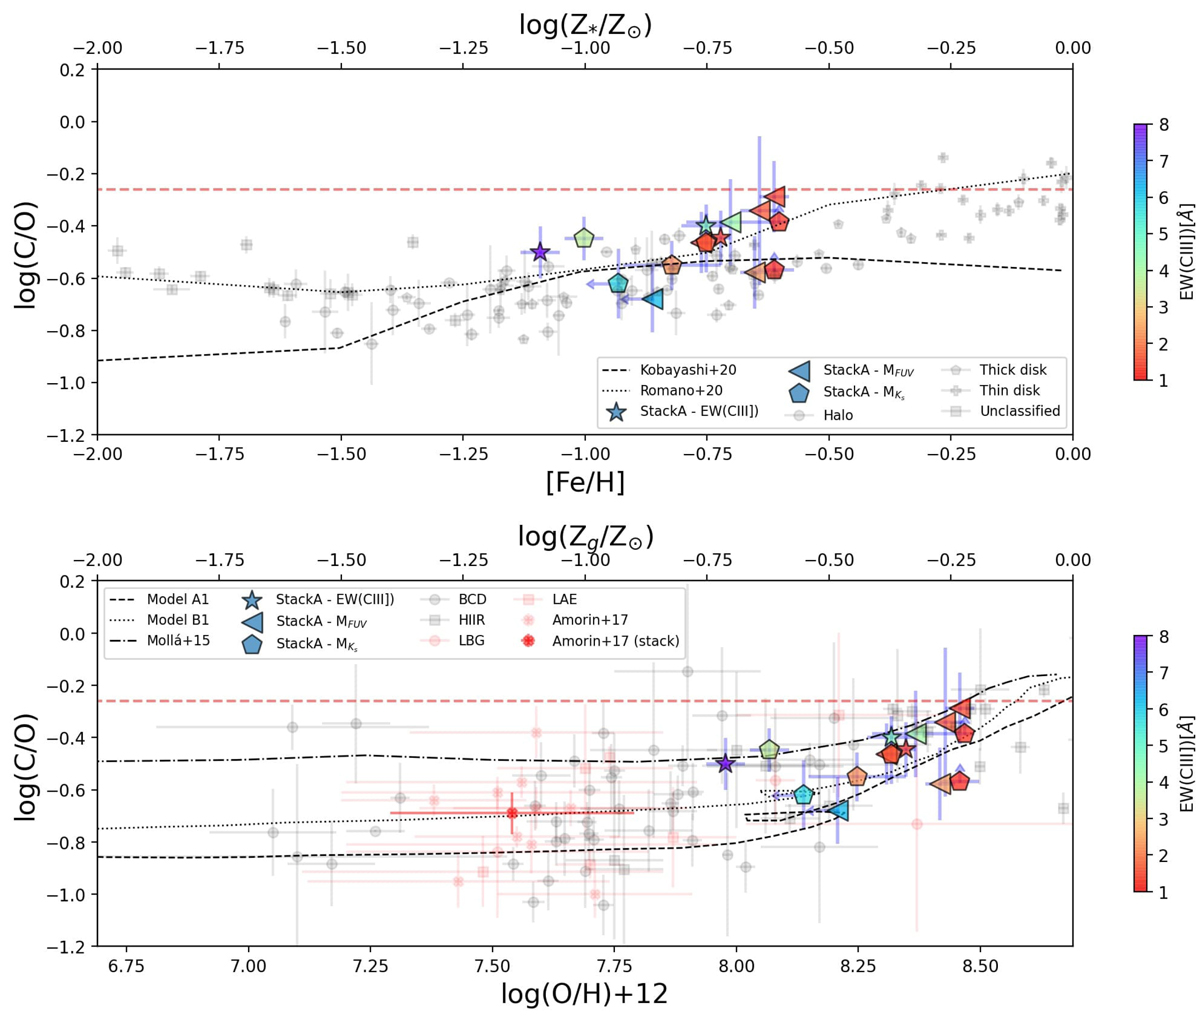
Fig. 21.
Download original image
Relation between C/O and metallicity. Left panel: C/O–Z⋆ relation. Black symbols are values of stars from the Galactic thin, thick disk, halo and unclassified from the literature (Amarsi et al. 2019). The dashed black line is the K20 model in Kobayashi et al. (2020) and the dotted line is the model MWG-11 in Romano et al. (2020). Right panel: C/O–Zg relation. The red markers are high-redshift galaxies from literature and black markers are local galaxies and HII regions (see text for references). The multi-zone chemical evolution models from Mattsson (2010) are also shown by black lines. The green dotted-dashed line is the chemical model from Mollá et al. (2015). Both panels: the red dashed line is the C/O solar value. The stack A by EW(CIII]) and broad band luminosities are shown by markers according to legend and color-coded by EW(CIII]).
Current usage metrics show cumulative count of Article Views (full-text article views including HTML views, PDF and ePub downloads, according to the available data) and Abstracts Views on Vision4Press platform.
Data correspond to usage on the plateform after 2015. The current usage metrics is available 48-96 hours after online publication and is updated daily on week days.
Initial download of the metrics may take a while.