Fig. 18.
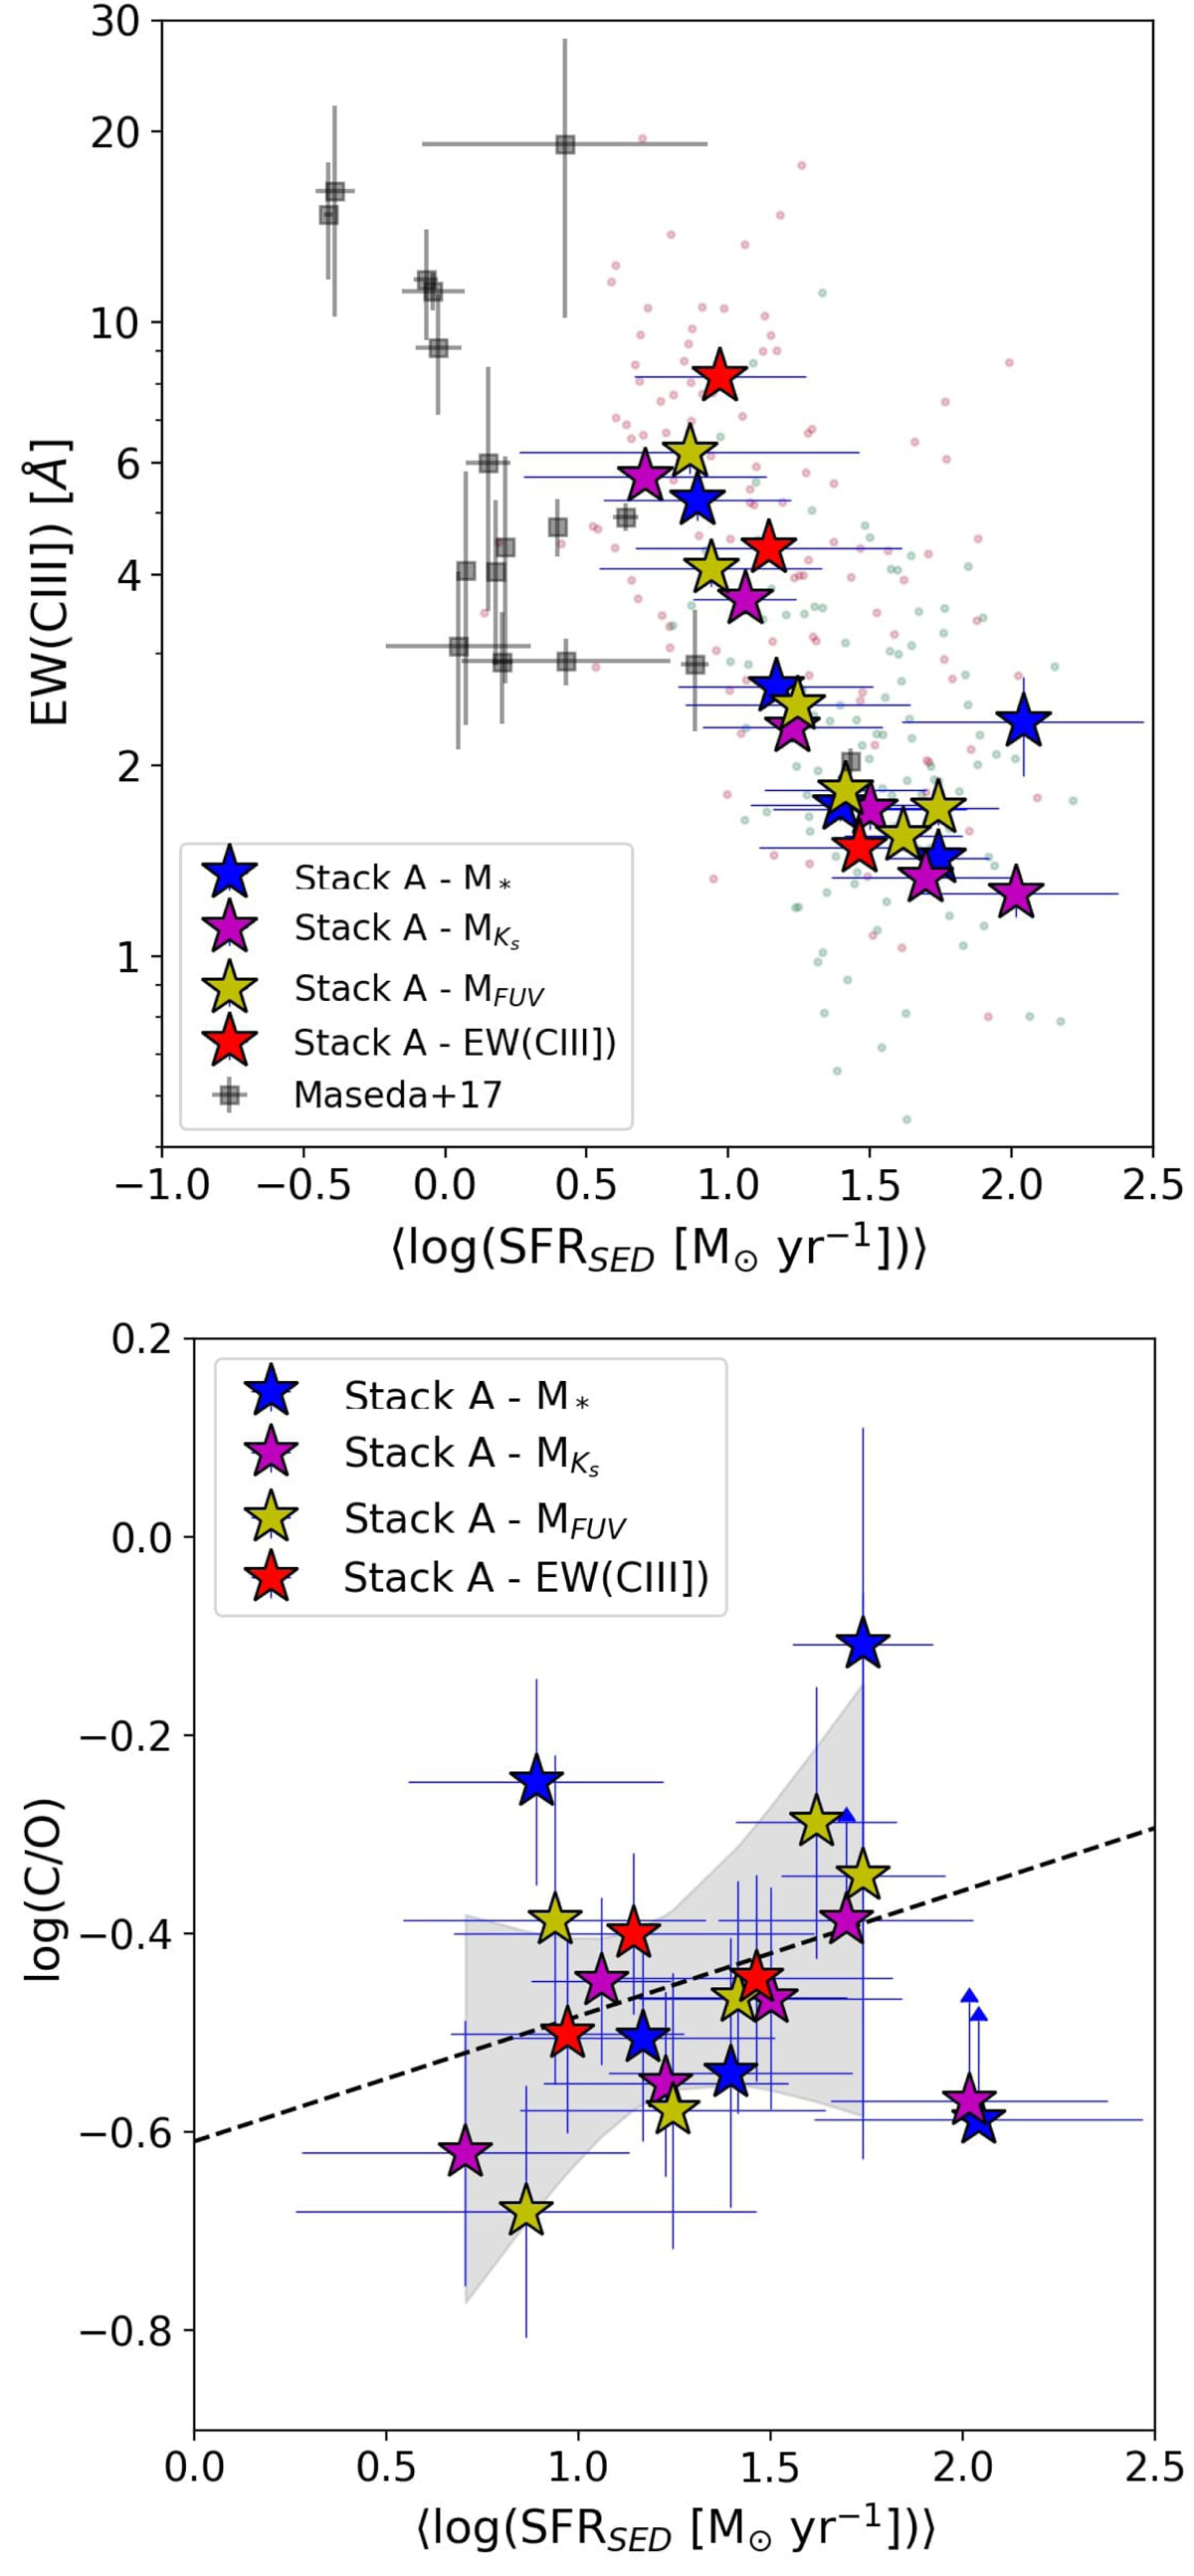
Download original image
Relation between SFR–EW(CIII]) (top panel) and SFR–C/O (bottom panel). Stars symbols are Stack A color-coded depending on the parameter used for stacking, according to legend, as in Fig. 13. Top panel: the black squares are results from CIII] emitters in Maseda et al. (2017). The small dots are the C3 sample with same colors as in Fig. 10. Bottom panel: the dashed black line is the best fit for the SFR–CO relation in Eq. (9).
Current usage metrics show cumulative count of Article Views (full-text article views including HTML views, PDF and ePub downloads, according to the available data) and Abstracts Views on Vision4Press platform.
Data correspond to usage on the plateform after 2015. The current usage metrics is available 48-96 hours after online publication and is updated daily on week days.
Initial download of the metrics may take a while.