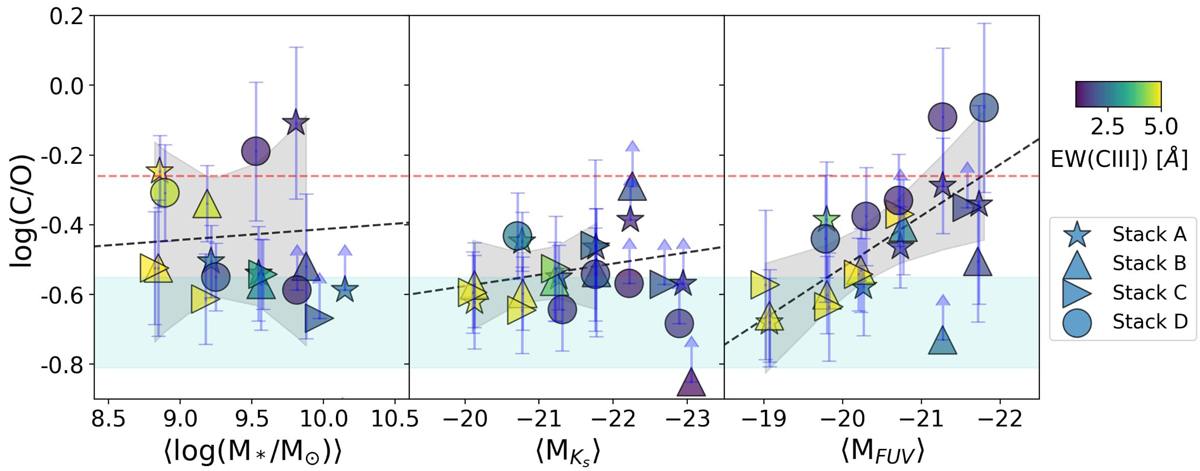
Fig. 17.
Download original image
Relation between the different physical properties used for the stacks and C/O ratio using as derived using HCM-UV. The red dashed line corresponds to the solar value. The cyan shaded region is from Shapley et al. (2003). The results of the stacks are color coded by EW(CIII]). The black dashed line is the best linear fit for each parameter in Eqs. (6)–(8), respectively.
Current usage metrics show cumulative count of Article Views (full-text article views including HTML views, PDF and ePub downloads, according to the available data) and Abstracts Views on Vision4Press platform.
Data correspond to usage on the plateform after 2015. The current usage metrics is available 48-96 hours after online publication and is updated daily on week days.
Initial download of the metrics may take a while.