Fig. 16.
Download original image
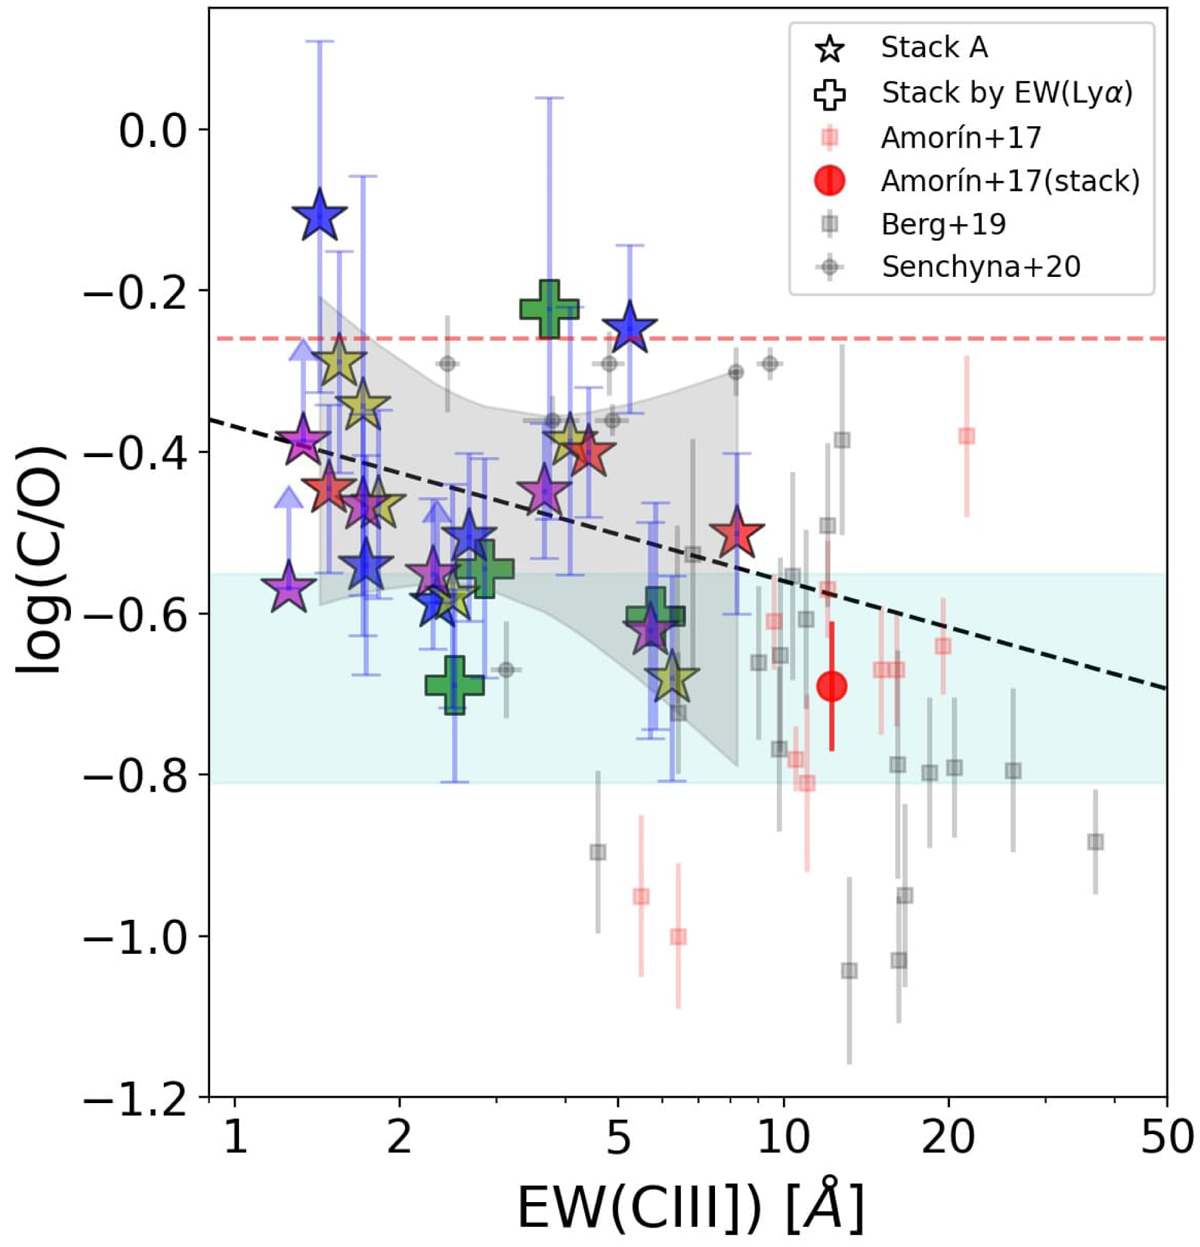
Relation between the EW(CIII]) and C/O ratio as derived using HCM-UV. The red dashed line corresponds to the solar value. The cyan shaded region is the average C/O for Lyman-break galaxies in Shapley et al. (2003) and the red circle is the result for a composite spectrum of CIII]-emitters in Amorín et al. (2017). Individual CIII] emitters at high-z (red squares, Amorín et al. 2017) and low-z (black squares and circles, Berg et al. 2019a; Senchyna et al. 2021) are also included. Colors for our stacks are the same as in Fig. 13. The black dashed line is the best linear fit to our stacks, as displayed in Eq. (5).
Current usage metrics show cumulative count of Article Views (full-text article views including HTML views, PDF and ePub downloads, according to the available data) and Abstracts Views on Vision4Press platform.
Data correspond to usage on the plateform after 2015. The current usage metrics is available 48-96 hours after online publication and is updated daily on week days.
Initial download of the metrics may take a while.