Fig. 13.
Download original image
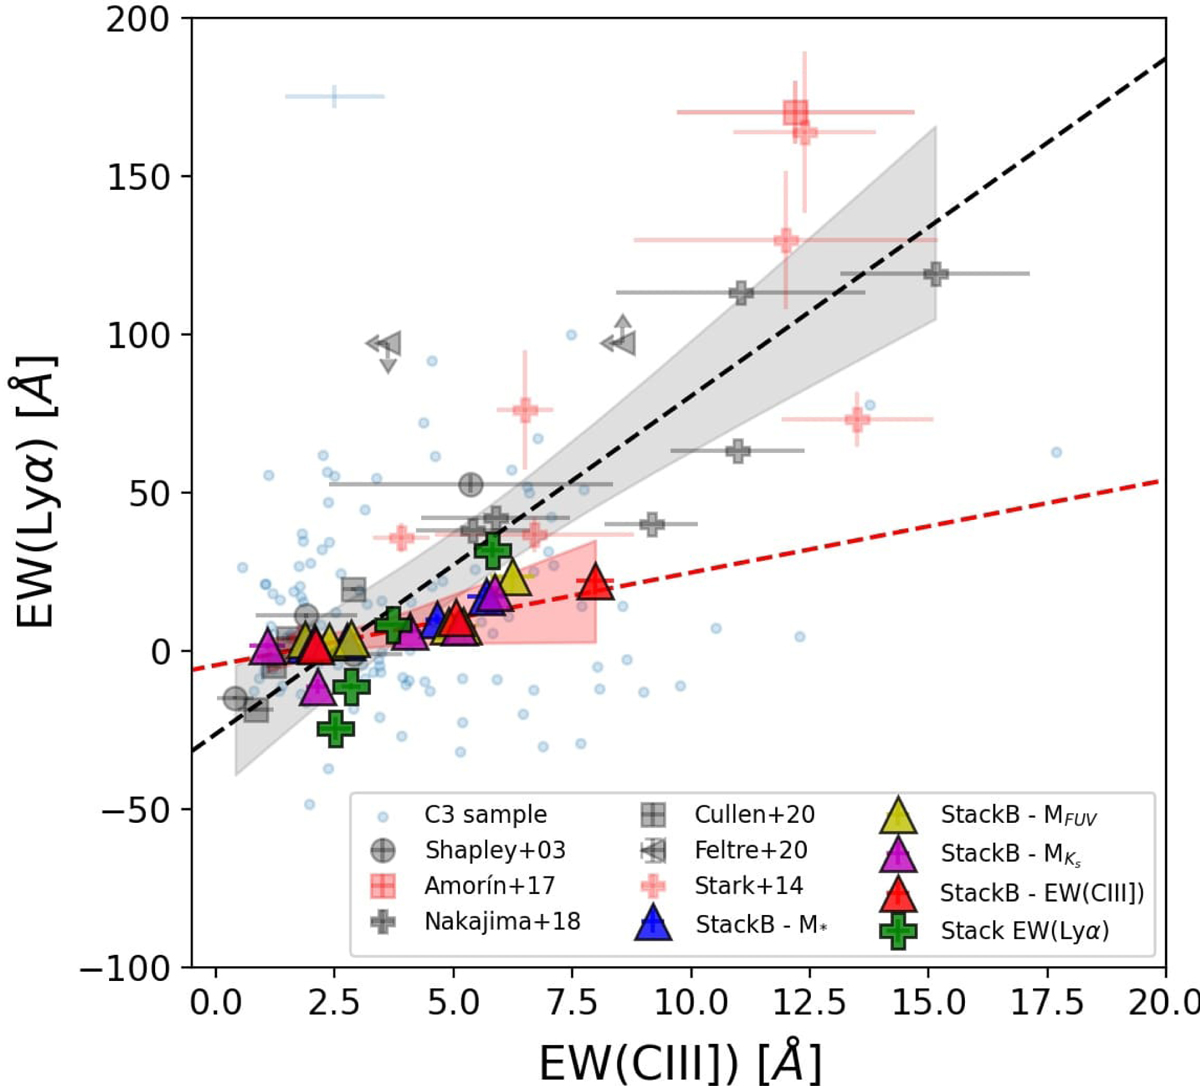
EW(Lyα)–EW(CIII]) relation. The results from stacks B are represented by the triangle symbols, with different color depending on the parameter used for stacking: blue for stellar mass, yellow for FUV luminosity, magenta for Ks luminosity, red for EW(CIII]), and green for EW(Lyα). Individual galaxies with measured Lyα from the C3 sample are the small blue circles with their typical errors on the upper left. Previous results from literature at similar redshift are also displayed from stacking (Shapley et al. 2003; Amorín et al. 2017; Nakajima et al. 2018b; Cullen et al. 2020; Feltre et al. 2020) and individual objects (Stark et al. 2014). Dashed black line is the best fit in Eq. (1) including our stacks and the sample from literature. Dashed red line is the best fit in Eq. (2), including just our stacks.
Current usage metrics show cumulative count of Article Views (full-text article views including HTML views, PDF and ePub downloads, according to the available data) and Abstracts Views on Vision4Press platform.
Data correspond to usage on the plateform after 2015. The current usage metrics is available 48-96 hours after online publication and is updated daily on week days.
Initial download of the metrics may take a while.