Fig. 12.
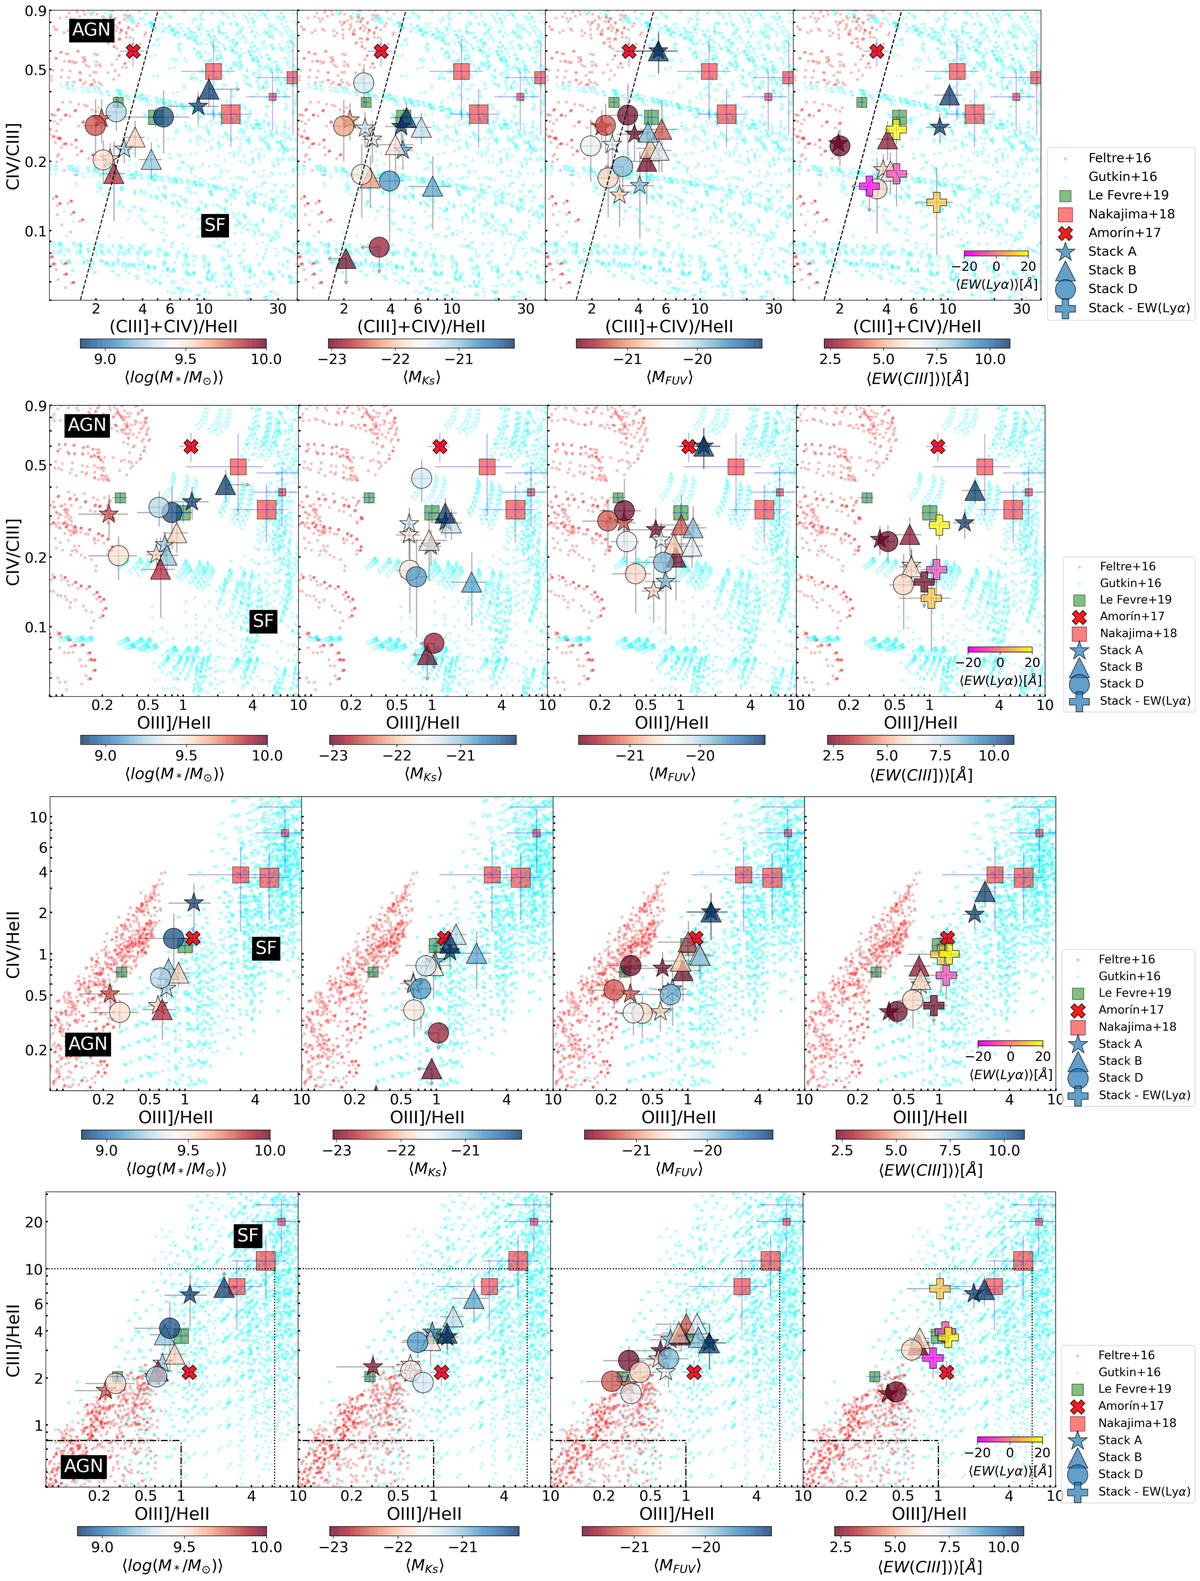
Download original image
Diagnostic diagrams with fluxes of UV emission lines for the different stack sets, color-coded by the parameter used for stacking. Symbols are the same as in Fig. 11. The red and cyan points are the photoionization models for AGN (Feltre et al. 2016) and SF (Gutkin et al. 2016) for metallicity Z = 0.0001, 0.0002, 0.0005, 0.001, 0.002, and for ionization parameter log(U) = −4, −3, −2, −1. The dotted-dashed lines in the bottom panel separates composite and AGNs according to Hirschmann et al. (2019).
Current usage metrics show cumulative count of Article Views (full-text article views including HTML views, PDF and ePub downloads, according to the available data) and Abstracts Views on Vision4Press platform.
Data correspond to usage on the plateform after 2015. The current usage metrics is available 48-96 hours after online publication and is updated daily on week days.
Initial download of the metrics may take a while.