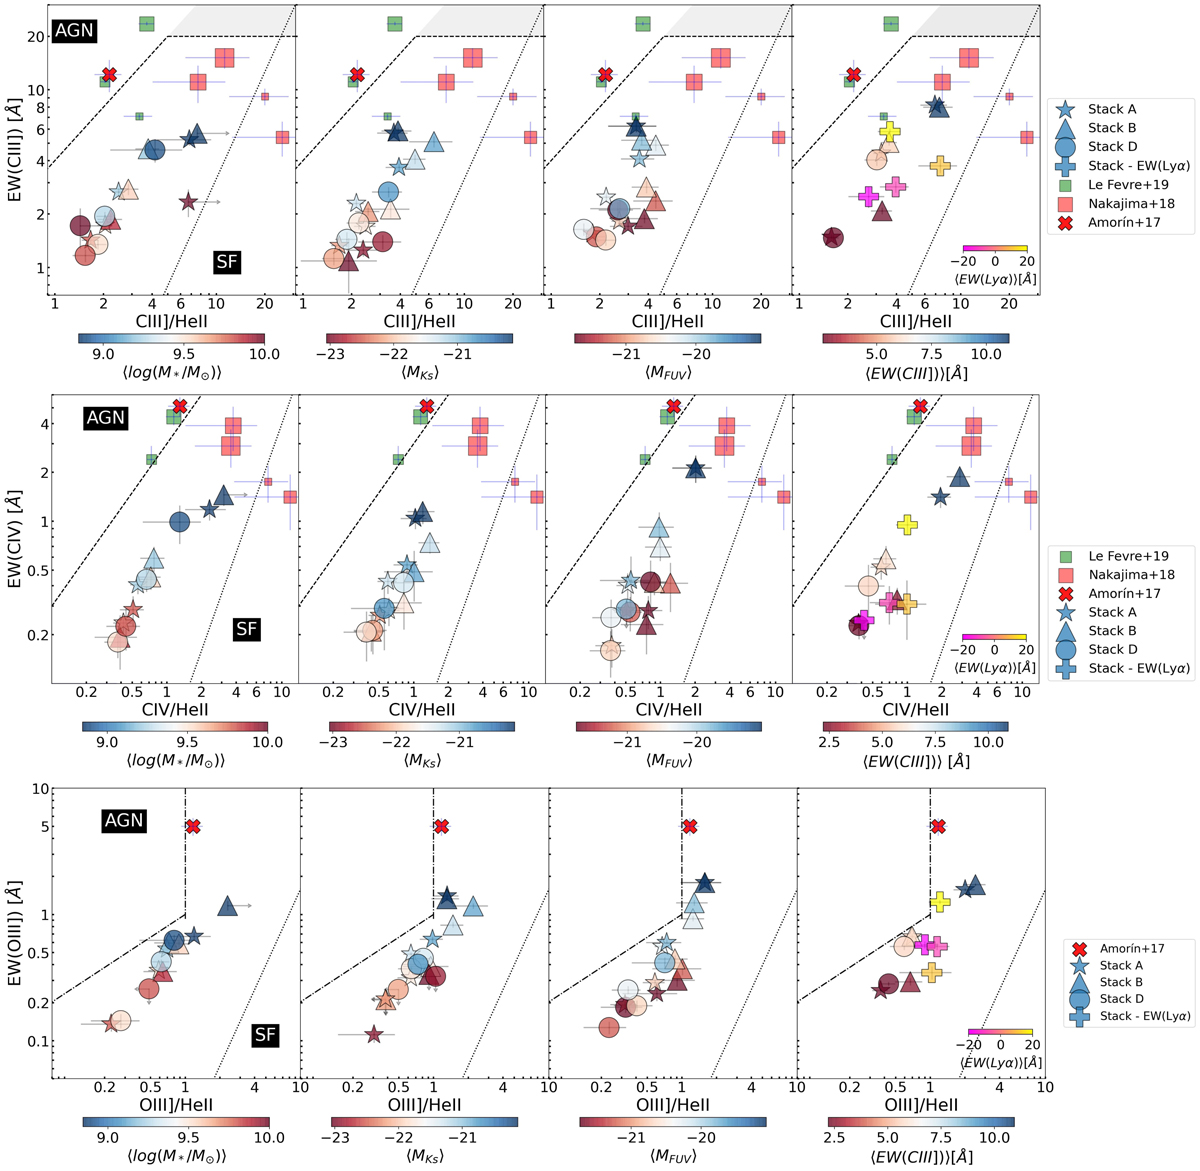
Fig. 11.
Download original image
Diagnostic diagrams with EW of UV emission lines for the different stack sets, color-coded by the parameter used for stacking. The black dashed lines separate AGNs and star-forming galaxies as proposed in Nakajima et al. (2018a). The dotted and dotted-dashed lines are from Hirschmann et al. (2019), meant to separate between SFGs and composite as well as composite and AGN, respectively. Top row: diagnostic of EW(CIII])–CIII]/HeII ratio. The gray shaded region is where the models overlap. Middle row: diagnosis of EW(CIV)–CIV/HeII ratio. Bottom row: diagnosis of EW(OIII])–OIII]/HeII ratio. The green boxes are the composites from Le Fèvre et al. (2019) and the higher the size, the higher the EW (CIII]). The red X mark is the composite from Amorín et al. (2017). The red rectangles are the stacks from Nakajima et al. (2018b) with the brightest MUV (smallest rectangle), smaller EW(Lyα), faintest MUV, and larger EW(Lyα) (largest rectangle).
Current usage metrics show cumulative count of Article Views (full-text article views including HTML views, PDF and ePub downloads, according to the available data) and Abstracts Views on Vision4Press platform.
Data correspond to usage on the plateform after 2015. The current usage metrics is available 48-96 hours after online publication and is updated daily on week days.
Initial download of the metrics may take a while.