Fig. 1.
Download original image
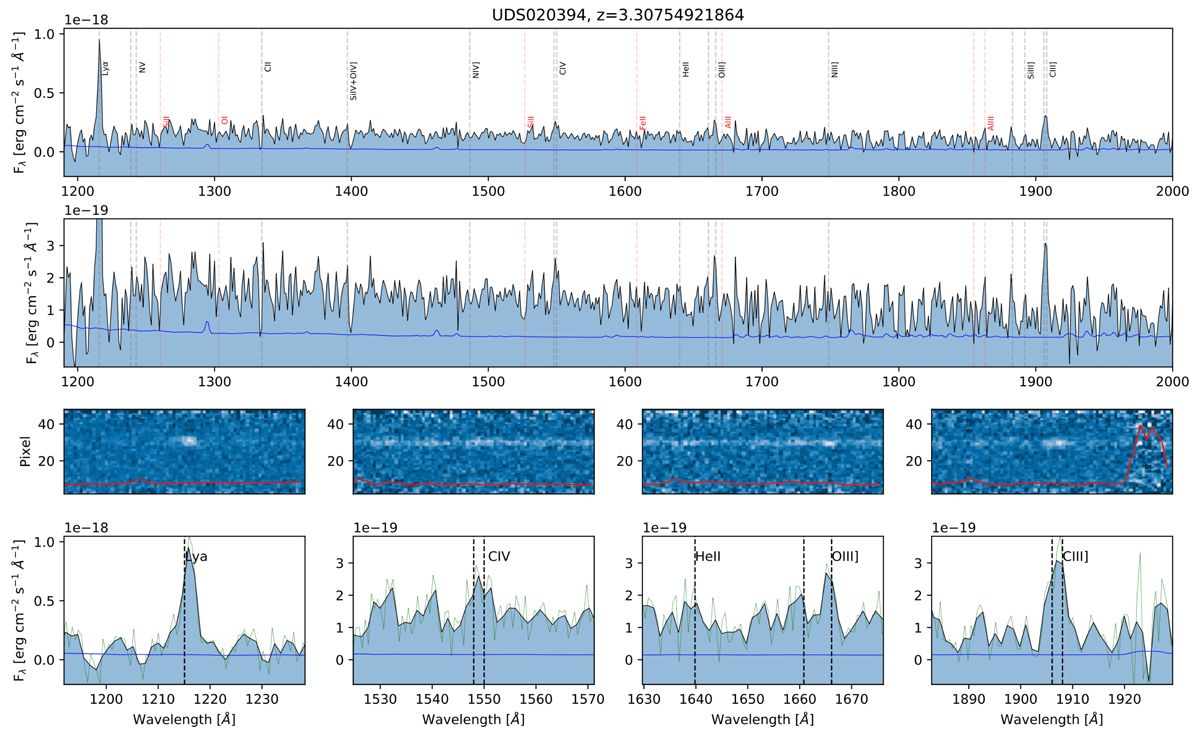
Spectrum of UDS20394, one of the more intense CIII] emitters in the C3 sample, whose estimated parameters are log(M⋆/M⊙) = 9.32, SFR = 4.01 M⊙ yr−1, MFUV = −20, MKs = −20.46, EW(Lyα) = 19.2 Å, and EW(CIII]) = 12.3 Å. The green faint line is the de-redshifted VANDELS spectrum and the black line is the same but resampled by a factor of 2. The blue line in the upper panels is the error spectrum. The red line in the intermediate panels is the scaled sky spectrum.
Current usage metrics show cumulative count of Article Views (full-text article views including HTML views, PDF and ePub downloads, according to the available data) and Abstracts Views on Vision4Press platform.
Data correspond to usage on the plateform after 2015. The current usage metrics is available 48-96 hours after online publication and is updated daily on week days.
Initial download of the metrics may take a while.