Free Access
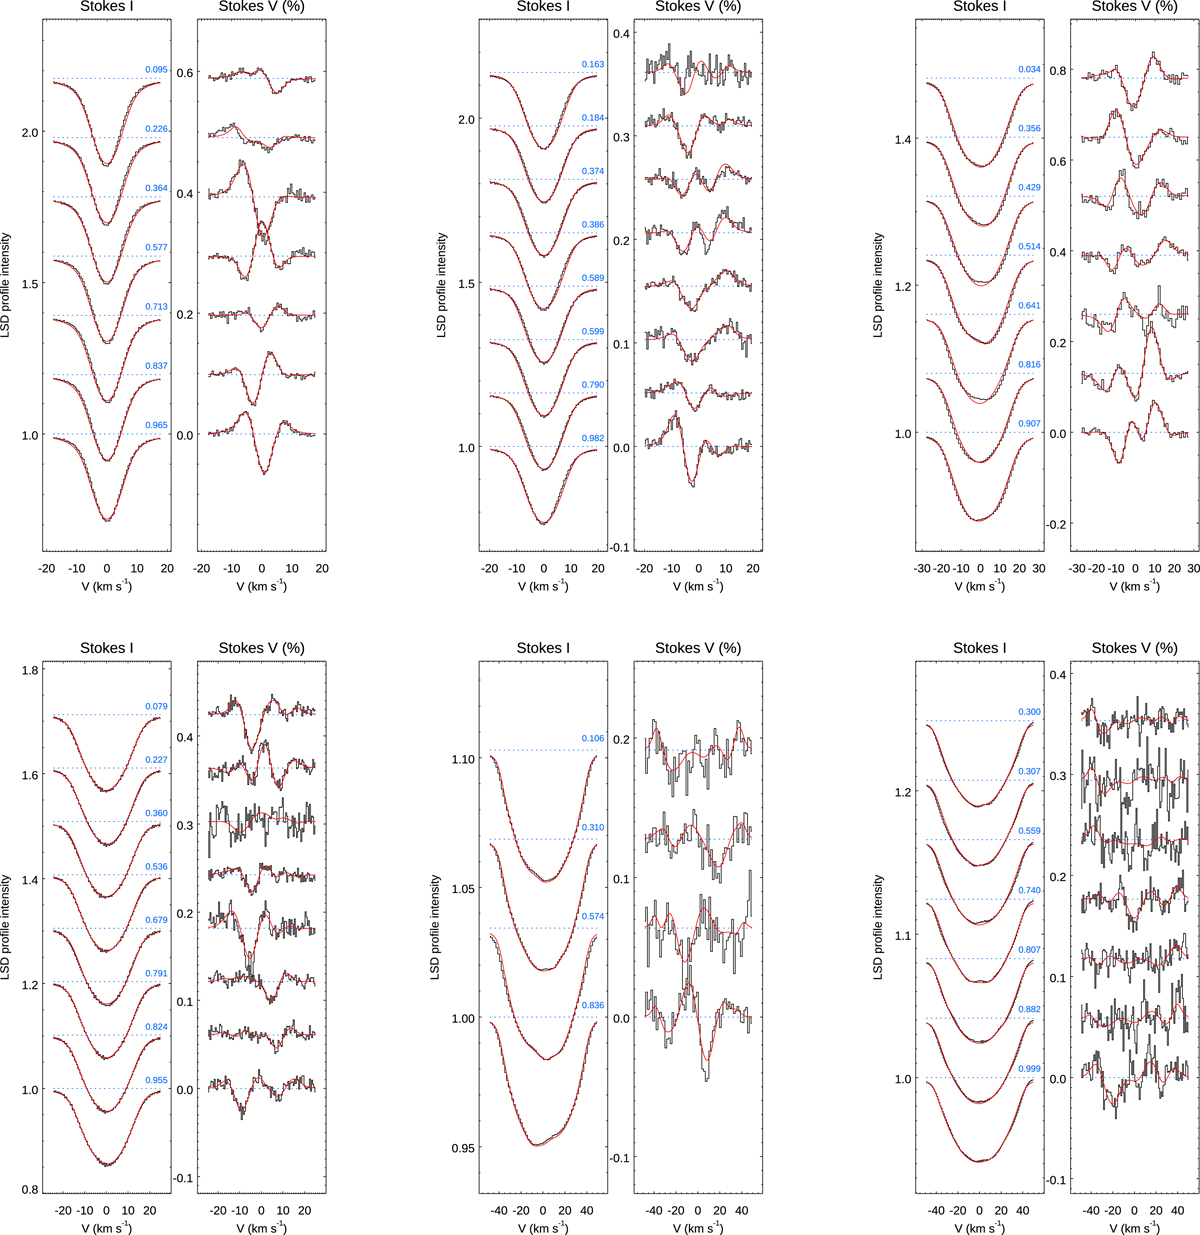
Fig. A.1.
Download original image
LSD profiles for BE Cet (upper left), χ1 Ori (upper centre), HD 29615 (upper right), HD 35296 (lower left), and V1358 Ori (lower centre - 2013; and lower right - 2017). The black line profiles are the observed Stokes profiles, and the red fits are the LSD profiles. The rotational phase is indicated for each profile.
Current usage metrics show cumulative count of Article Views (full-text article views including HTML views, PDF and ePub downloads, according to the available data) and Abstracts Views on Vision4Press platform.
Data correspond to usage on the plateform after 2015. The current usage metrics is available 48-96 hours after online publication and is updated daily on week days.
Initial download of the metrics may take a while.