Fig. 7.
Download original image
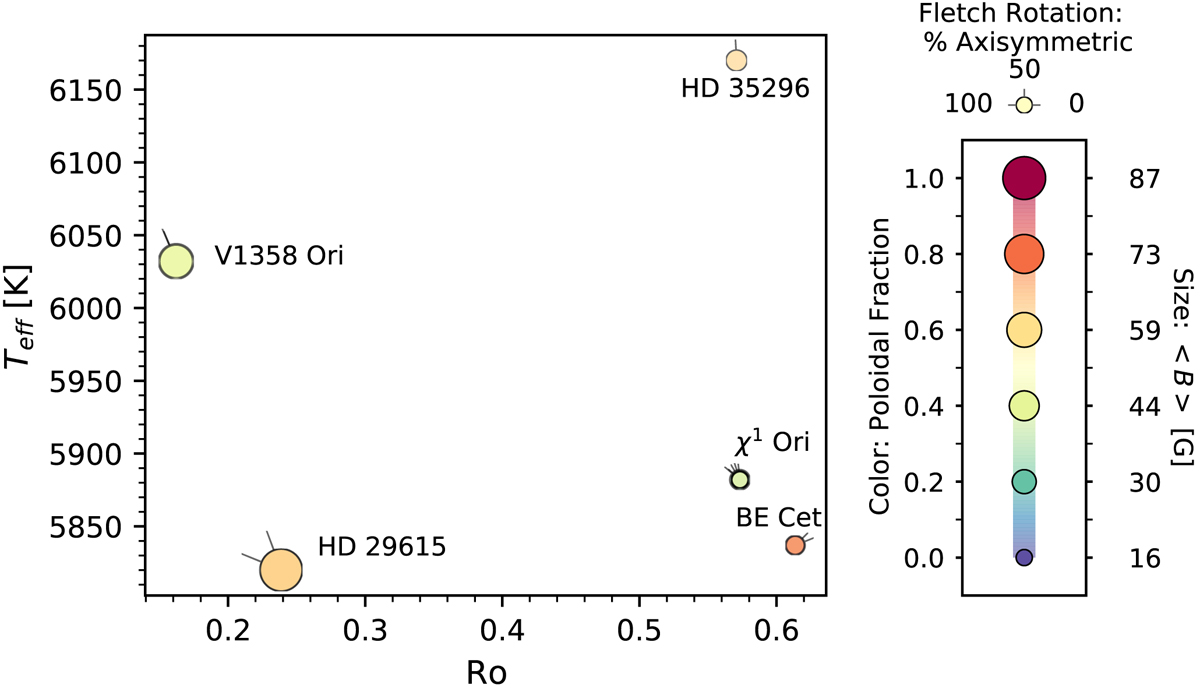
Effective temperature of the stars as a function of the Rossby number. The colour of the symbol corresponds to the fraction of poloidal field, and the size to the average surface magnetic field strength. The rotated fletches show the percentage of axisymmetric field in the map. For individual stars, variations of axisymmetry between different epochs are visually most clearly presented, but variations in the magnetic field strength can also in principle be seen as differences in the sizes of overplotted circles and variations in the poloidal fraction in their blended colours. In addition to our results from Table 4, there is one additional BE Cet data point and four χ1 Ori data points from Rosén et al. (2016), and one HD 29615 data point from Hackman et al. (2016). See Sect. 5 for more details.
Current usage metrics show cumulative count of Article Views (full-text article views including HTML views, PDF and ePub downloads, according to the available data) and Abstracts Views on Vision4Press platform.
Data correspond to usage on the plateform after 2015. The current usage metrics is available 48-96 hours after online publication and is updated daily on week days.
Initial download of the metrics may take a while.