Free Access
Fig. 2.
Download original image
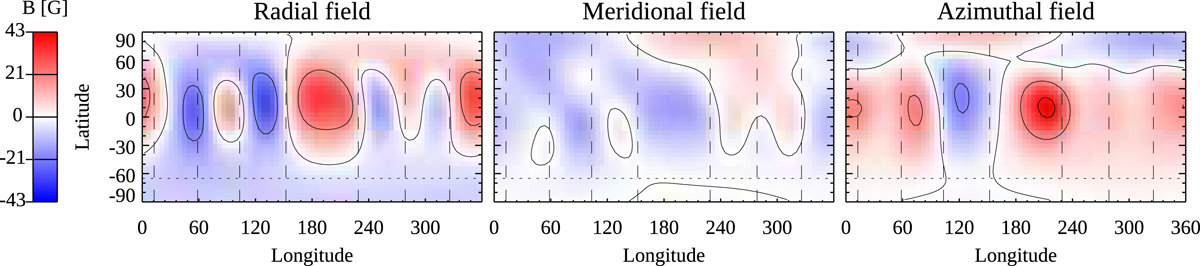
ZDI map for BE Cet. The vertical lines indicate the phases of individual spectra. The horizontal line marks the inclination of the star. For the parts below it, around the invisible pole, there is no information in the data.
Current usage metrics show cumulative count of Article Views (full-text article views including HTML views, PDF and ePub downloads, according to the available data) and Abstracts Views on Vision4Press platform.
Data correspond to usage on the plateform after 2015. The current usage metrics is available 48-96 hours after online publication and is updated daily on week days.
Initial download of the metrics may take a while.