Fig. 3.
Download original image
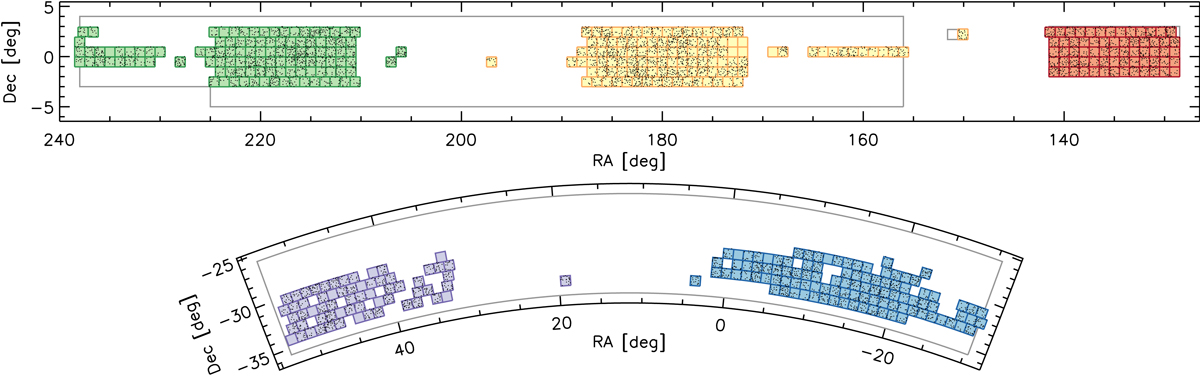
Overview of the KiDS-450 observations, with the KiDS-N (upper) and KiDS-S (lower) patches. The solid gray lines represent the planned KiDS survey area. Overplotted are the observed 1 square degree tiles, color coded with respect to their correspondence with the GAMA survey patches (G9 red, G12 yellow, G15 green, G23 blue, and GS purple; see Hildebrandt et al. 2017, for more details). The AMICO clusters analyzed in this work are represented by black dots.
Current usage metrics show cumulative count of Article Views (full-text article views including HTML views, PDF and ePub downloads, according to the available data) and Abstracts Views on Vision4Press platform.
Data correspond to usage on the plateform after 2015. The current usage metrics is available 48-96 hours after online publication and is updated daily on week days.
Initial download of the metrics may take a while.