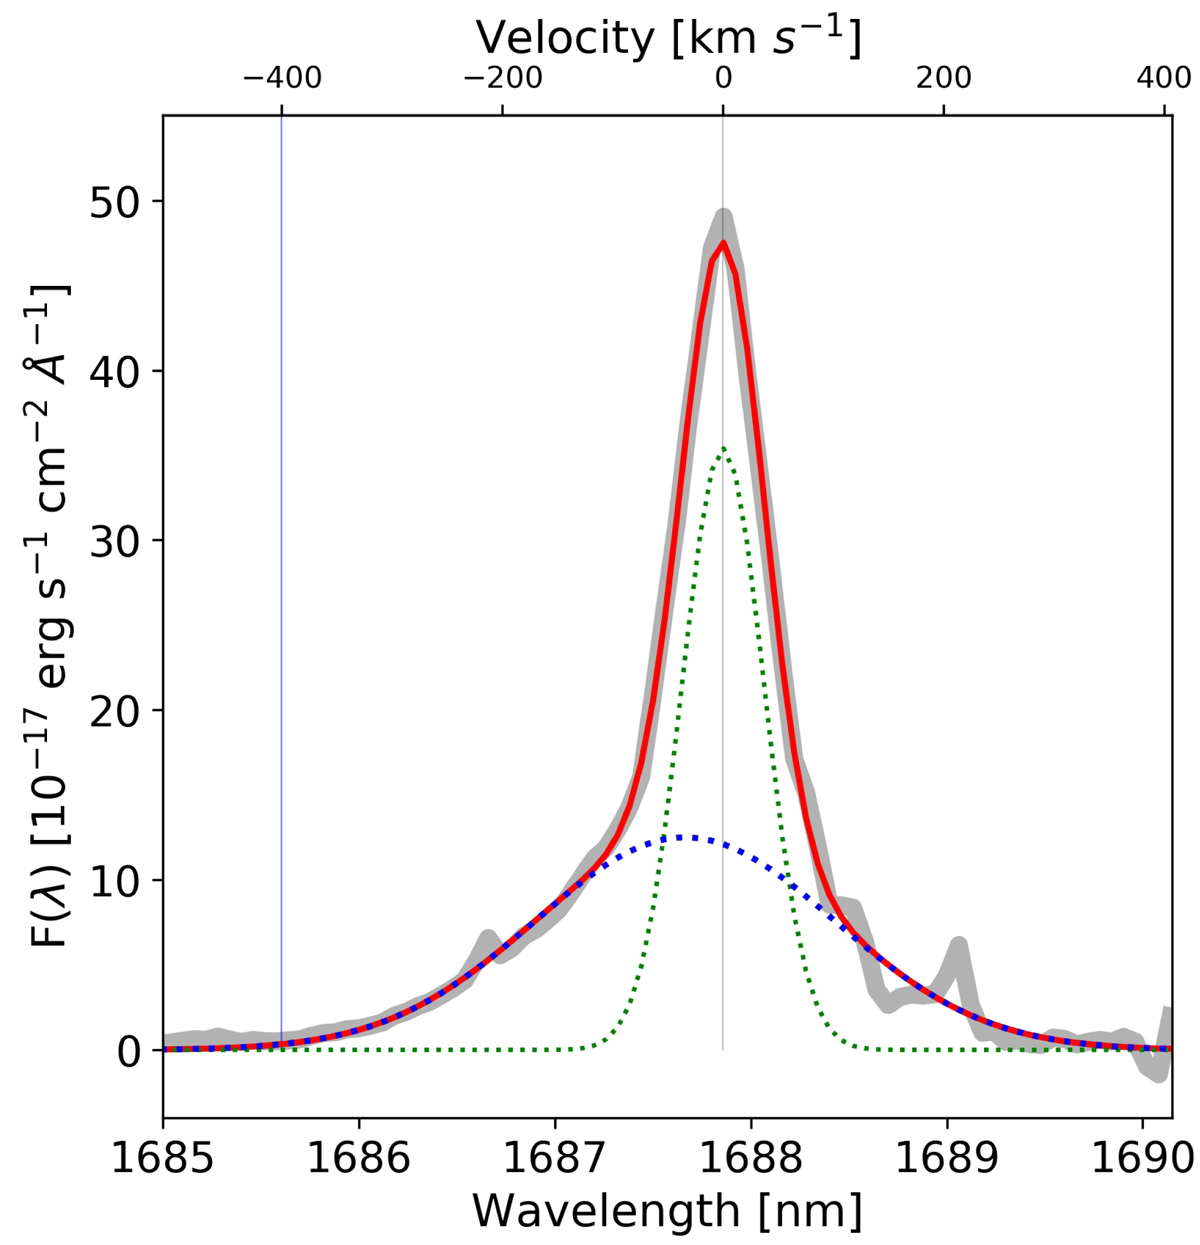
Fig. B.1.
Download original image
[O III]λ5007 line emerging from the LyC knot 5.1 (gray band) and the best-fit solution made of the sum of two Gaussian components (red line), a broad one tracing the outflowing ionized gas (blue dotted) and the other tracing the core of the line; the latter arises from the H II region surrounding the star cluster and tracing the redshift of the stellar component (green dotted). On top axis, the velocity is referred to the peak position of the line. The clear blue tail extends up to −400 km s−1.
Current usage metrics show cumulative count of Article Views (full-text article views including HTML views, PDF and ePub downloads, according to the available data) and Abstracts Views on Vision4Press platform.
Data correspond to usage on the plateform after 2015. The current usage metrics is available 48-96 hours after online publication and is updated daily on week days.
Initial download of the metrics may take a while.