Fig. A.1.
Download original image
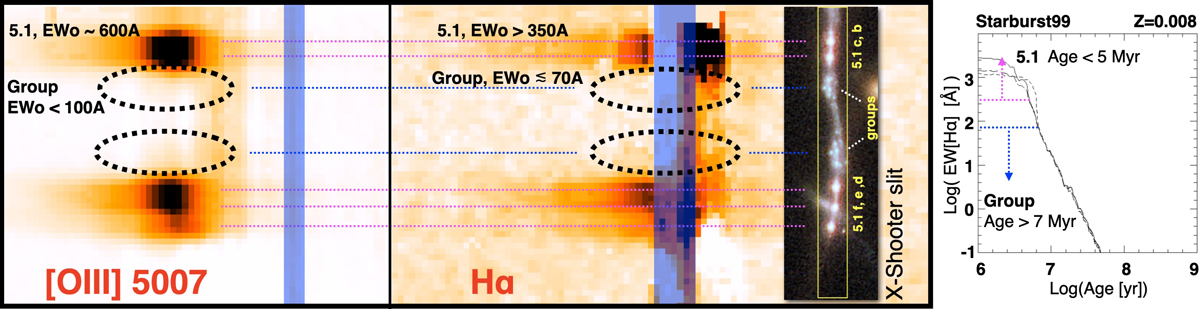
Main panel (thick line box): the [O III]λ5007 (left) and the Hα (right) two-dimensional zoomed spectra extracted from X-Shooter observations at spectral resolution R ≃5600. The slit orientation is indicated with the yellow box in the inset showing the HST color image. The magenta dotted lines mark the position of the knots 5.1b, c and 5.1d, e, f over the spatial direction along the slit. The blue dotted lines show the expected positions of the region collecting the group of fainter knots, named “group” in the figure (see also Figure 2). Hα and [O III]λ5007 clearly emerge from knots 5.1b, c, d, e, f, conversely the same lines are not detected for the two mirrored “groups” at the given depth. The inferred rest-frame equivalent widths are also quoted. The transparent vertical blue stripes mark the position of night sky emission lines. The right panel shows the Hα equivalent width as a function of time from a Starburst99 model of an instantaneous burst and Z = 0.008Z⊙. Magenta and blue dotted arrows indicate the case of the knot 5.1 and “Group”, respectively. Knot 5.1 is younger than 5 Myr (in agreement with the 3 Myr old age derived by Chisholm et al. 2019), while the complex “group” is likely older than 7 Myr.
Current usage metrics show cumulative count of Article Views (full-text article views including HTML views, PDF and ePub downloads, according to the available data) and Abstracts Views on Vision4Press platform.
Data correspond to usage on the plateform after 2015. The current usage metrics is available 48-96 hours after online publication and is updated daily on week days.
Initial download of the metrics may take a while.