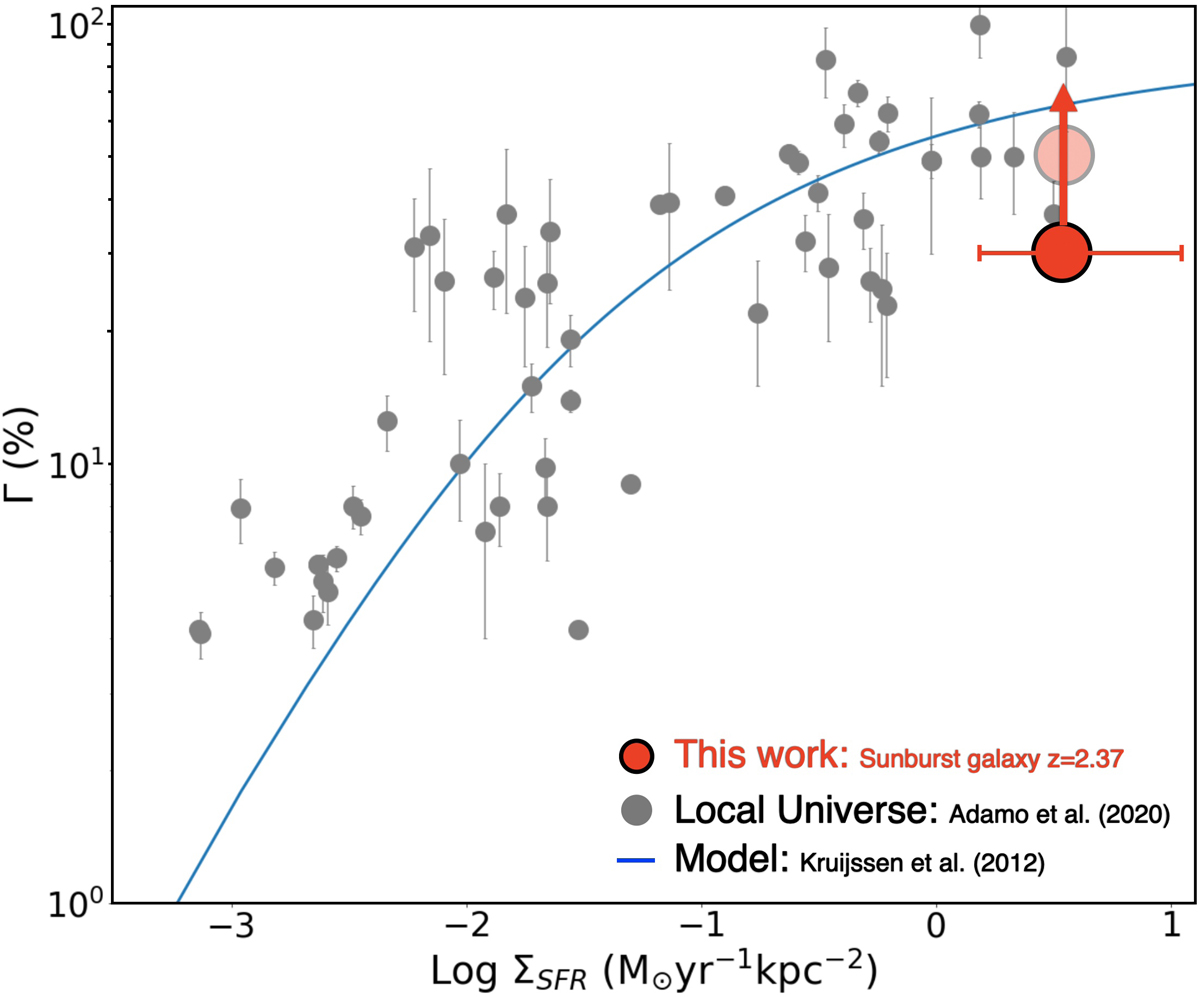
Fig. 6.
Download original image
Cluster formation efficiency, Γ, as a function of the star-formation rate surface density ΣSFR. The compilation of gray symbols represent estimates in the local Universe taken from Adamo et al. (2020a,b). The solid blue line reproduces the Kruijssen (2012) fiducial model. The estimated lower limit on Γ (calculated over 20 Myr time scale, see text for details) for the Sunburst galaxy is reported with the filled red circle at 30%, while the transparent circle is the estimate fraction of the ultraviolet light (TL(UV)) computed from the delensed UV light integrated over all the star clusters reported in Table 1. The inferred quantities are likely lower limits, as additional clusters might have remained undetected.
Current usage metrics show cumulative count of Article Views (full-text article views including HTML views, PDF and ePub downloads, according to the available data) and Abstracts Views on Vision4Press platform.
Data correspond to usage on the plateform after 2015. The current usage metrics is available 48-96 hours after online publication and is updated daily on week days.
Initial download of the metrics may take a while.