Fig. 2.
Download original image
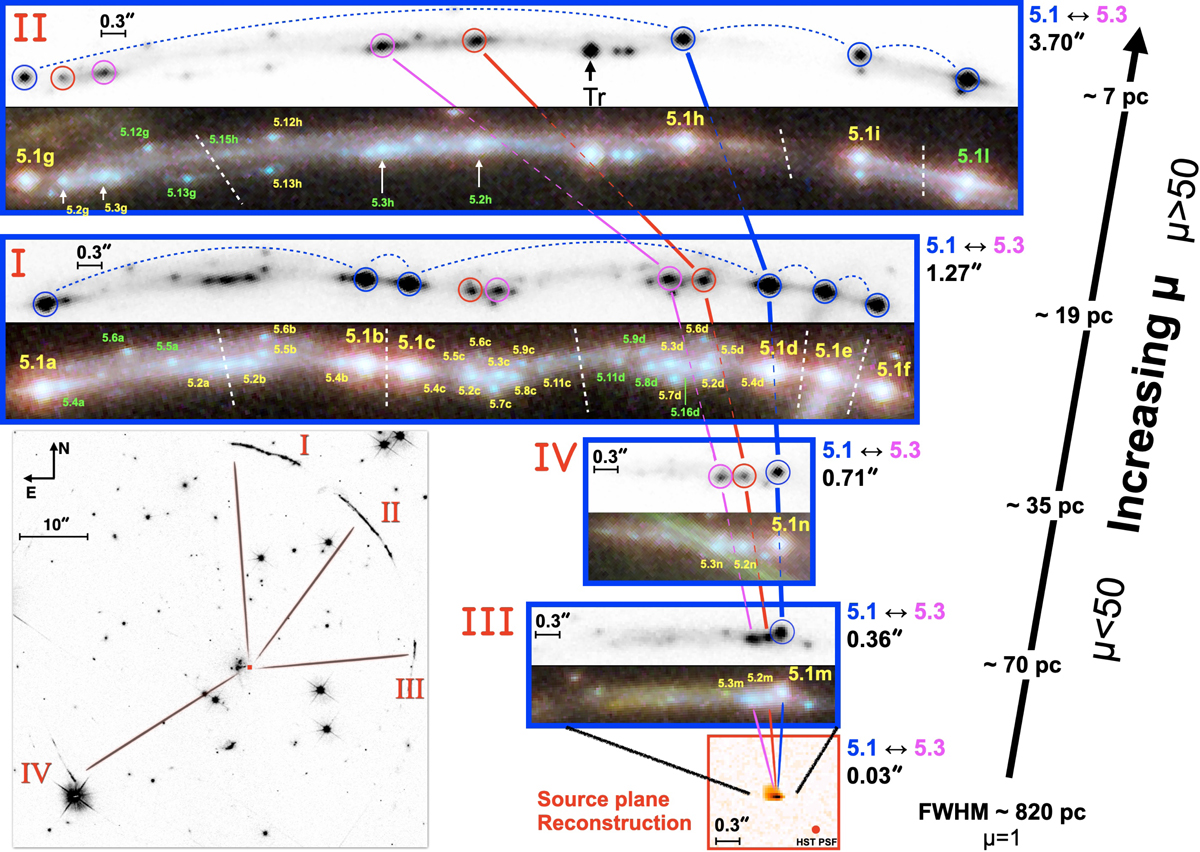
Identification of the multiple images of compact star-forming knots is shown. In the bottom-left of the figure, the negative gray-scaled HST ACS/F555W image shows the panoramic view of the four arcs, labeled as I, II, III, and IV, with the little red square in the middle indicating the source region subject to large amplification. The SF knots are shown in the blue border insets labeled as I, II, III, and IV, following the arcs notation in the bottom left inset and with increasing magnification from bottom to top (long arrow on the right). Each inset includes the negative gray scale F555W image and a color image obtained by combining the WFC3/UVIS F275W (blue), WFC3/UVIS F606W (cyan), ACS/WFC F814W (yellow), and WFC3/IR F160W (red) filters (ESA/Hubble, NASA, Rivera-Thorsen et al., CC BY 4.0). Star-forming regions are indicated following the nomenclature of Pignataro et al. (2021). White dashed lines mark the position of the critical lines. The main triplet, 5.1, 5.2, and 5.3 are indicated with blue, red, and magenta open circles, respectively. The objects labeled with green IDs are the knots reported in Table 1. Those marked in yellow show all the identified multiple images of the knots. The inset in the bottom right (red contour) shows the reconstructed image of the Sunburst galaxy on the source plane, where the triplet 5.1, 5.2, and 5.3 would merge into a single HST pixel (∼30 mas separation). The observed angular separation between the knots 5.1 and 5.3 is reported on the right side of each inset, and the typical physical scales subtended by the FWHM (0.1″) along tangential direction is shown over the long black arrow to the right (arc II includes star-forming region smaller 10 pc). The transient (“Tr”) discussed in Vanzella et al. (2020c) and corresponding to the knot 5.10 is indicated with a black arrow in the inset II.
Current usage metrics show cumulative count of Article Views (full-text article views including HTML views, PDF and ePub downloads, according to the available data) and Abstracts Views on Vision4Press platform.
Data correspond to usage on the plateform after 2015. The current usage metrics is available 48-96 hours after online publication and is updated daily on week days.
Initial download of the metrics may take a while.