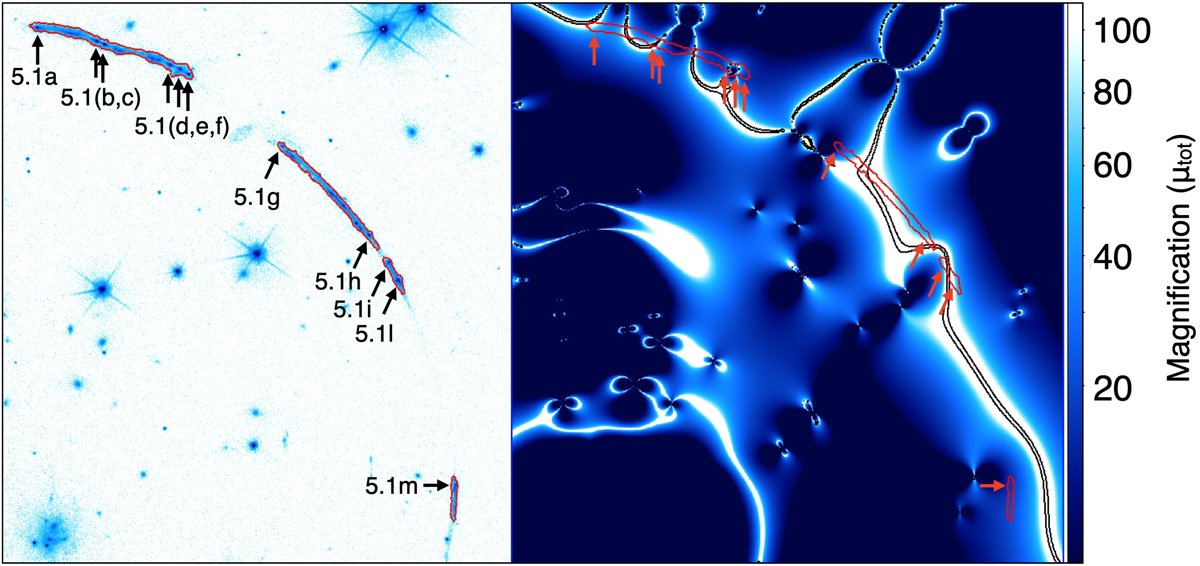
Fig. 1.
Download original image
Panoramic view of the main arcs discussed in this work. Left panel (in F555W-band image): Arcs are marked with red contours to guide the eye. The arrows indicate 11 multiple images of the star-forming knots labeled 5.1a–m (see text and Fig. 2 for additional details). The magnification map (total magnification, μtot) is reported on the right panel (from Pignataro et al. 2021) coded according with the color bar in square root scale: it saturates at μtot ≃ 10 (black) and 100 (white). The black contours enclose the region where μtot > 500, marking the locus of the critical line. The arcs contain multiple images of the same portions of the Sunburst galaxy and are subjected to amplification spanning the range 15 − 100, with the critical line crossing the arcs several times.
Current usage metrics show cumulative count of Article Views (full-text article views including HTML views, PDF and ePub downloads, according to the available data) and Abstracts Views on Vision4Press platform.
Data correspond to usage on the plateform after 2015. The current usage metrics is available 48-96 hours after online publication and is updated daily on week days.
Initial download of the metrics may take a while.