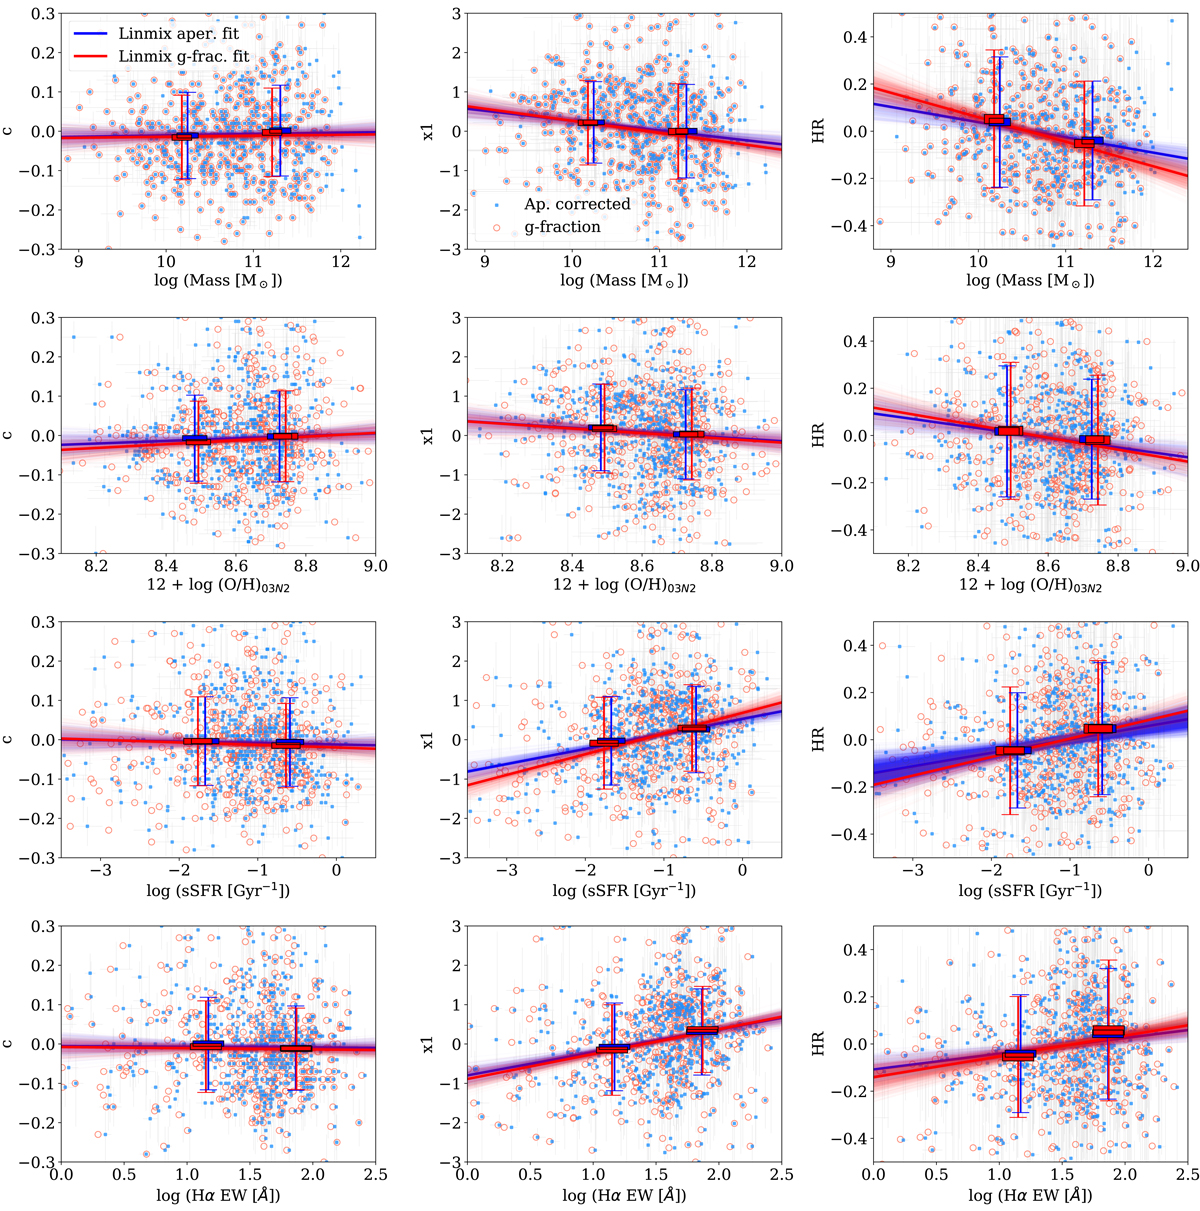
Fig. 9.

Download original image
x1, c, and Hubble residual correlations with host galaxy parameters – stellar mass, oxygen abundance, sSFR, and HαEW – for the aperture-corrected sample (in blue) and the g-band fraction sample (in red). Solid transparent lines are the 10 000 individual slopes found with the LINMIX MCMC sampler, with the average slope as a solid line on top. Overplotted there are the average and standard deviation of the variable on the Y-axis in each of the two high and low bins in the X-axis variable, which has been divided using the median X value as the split point. The height of the box represents the error of the mean in each bin.
Current usage metrics show cumulative count of Article Views (full-text article views including HTML views, PDF and ePub downloads, according to the available data) and Abstracts Views on Vision4Press platform.
Data correspond to usage on the plateform after 2015. The current usage metrics is available 48-96 hours after online publication and is updated daily on week days.
Initial download of the metrics may take a while.


