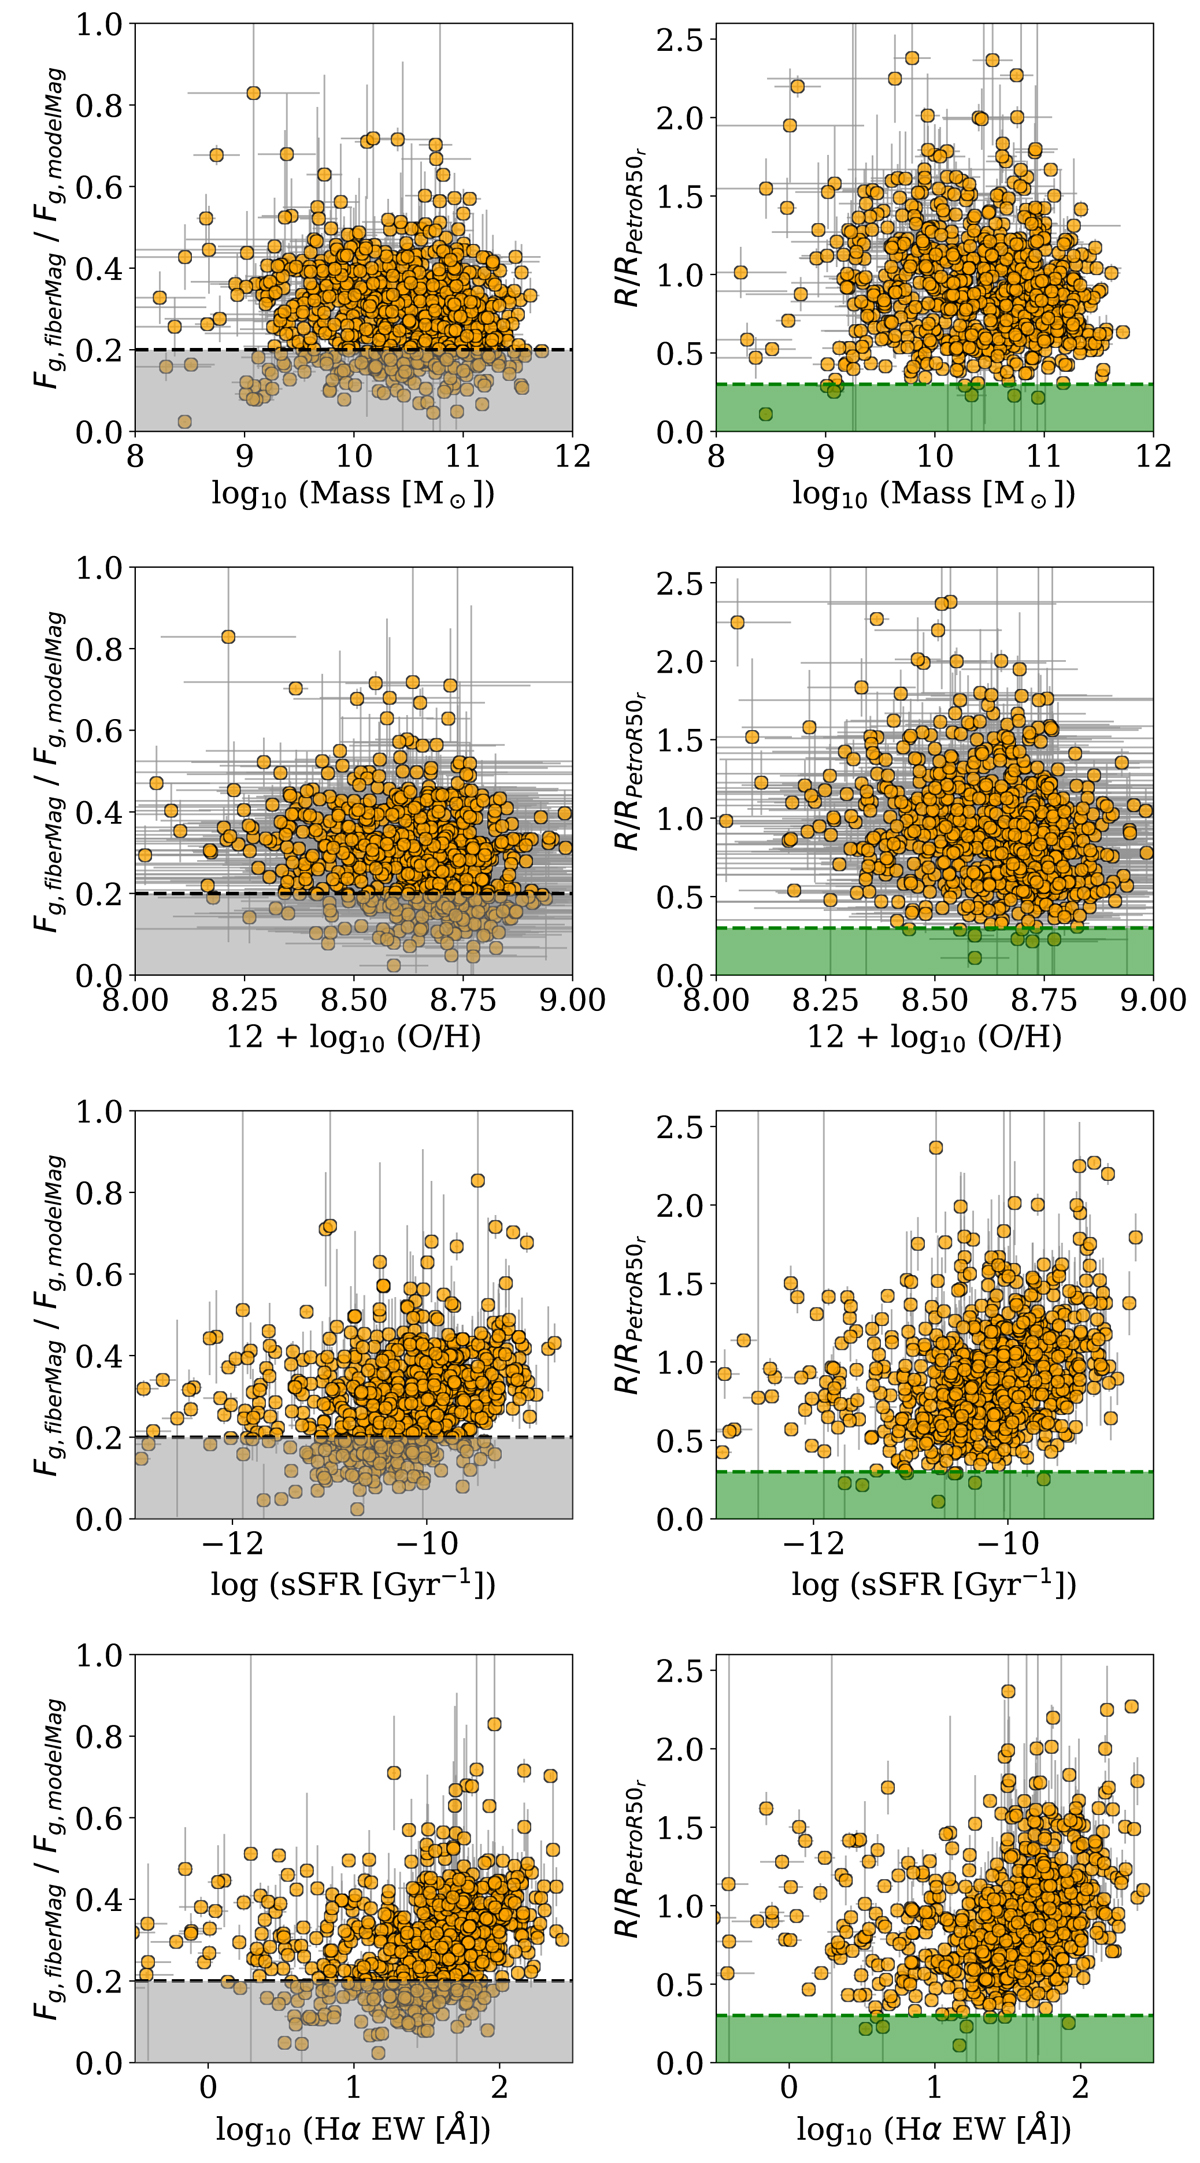
Fig. 7.

Download original image
g-band fraction (left column) and galaxy radius covered by the fiber in R50 units (right column) as a function of the main galaxy parameters used in this work: stellar mass, oxygen abundance, sSFR, and HαEW. The shadowed regions represent the regions excluded under each criterion. This figure clearly shows that under one criterion fewer objects are excluded, and it shows the tendency to exclude objects with higher or lower values for each galaxy parameter.
Current usage metrics show cumulative count of Article Views (full-text article views including HTML views, PDF and ePub downloads, according to the available data) and Abstracts Views on Vision4Press platform.
Data correspond to usage on the plateform after 2015. The current usage metrics is available 48-96 hours after online publication and is updated daily on week days.
Initial download of the metrics may take a while.


