Fig. 4.

Download original image
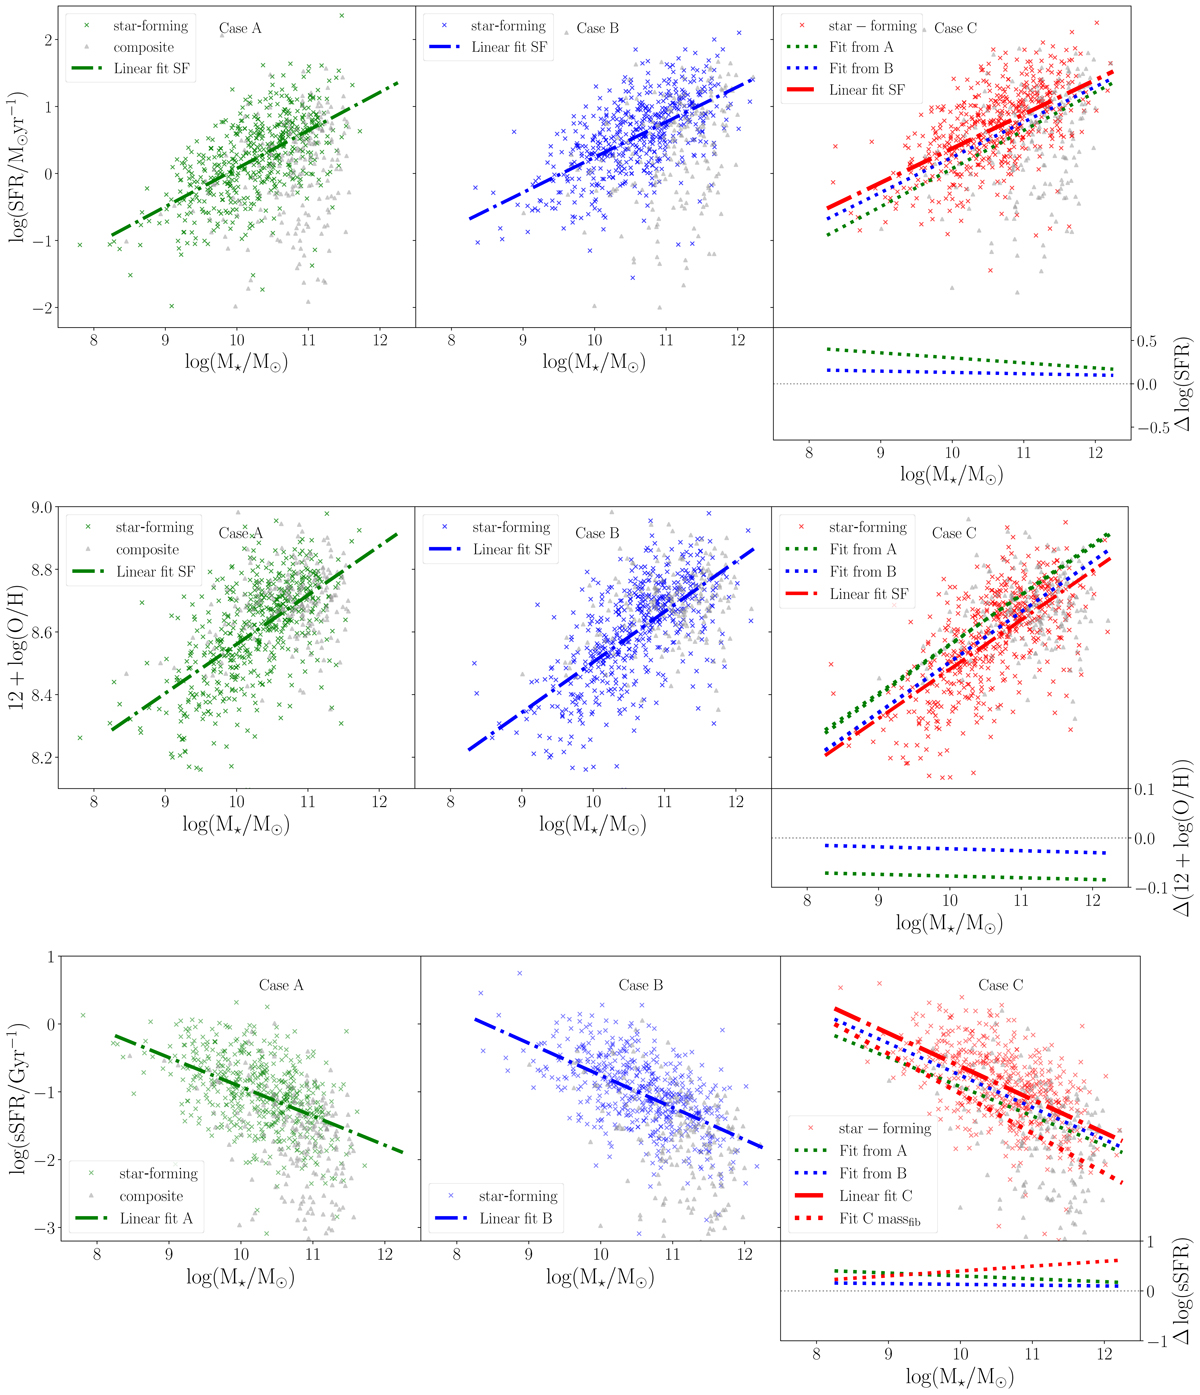
SFR–M⋆, O/H–M⋆, and sSFR–M⋆ relations for our sample of galaxies. Star-forming (colored crosses) and composite (gray triangles) galaxies based on the BPT classification are represented in each diagram. The left and central panels correspond to Case A and Case B, respectively. We included the linear fit of the SFR–M⋆ relation for all the SF galaxies. The right panels correspond to Case C, with the aperture corrected. In the upper panel we include the linear fit of the SFR–M⋆ relation for all the SF galaxies considered in Case C (dashed red line), the fit from Case A (dotted green line), and the fit from Case B (dotted blue line). In the bottom-right panel, the sSFR–M⋆ relation, we also include a fourth relation (dotted red) that corresponds to an aperture-corrected SFR (Case C) normalized to the mass measured in the fiber spectrum (Case A). In the lower panels we show the difference between the linear fit in Case C and the linear fits of Case A (dotted green line) and Case B (dotted blue line).
Current usage metrics show cumulative count of Article Views (full-text article views including HTML views, PDF and ePub downloads, according to the available data) and Abstracts Views on Vision4Press platform.
Data correspond to usage on the plateform after 2015. The current usage metrics is available 48-96 hours after online publication and is updated daily on week days.
Initial download of the metrics may take a while.


