Free Access
Fig. 9
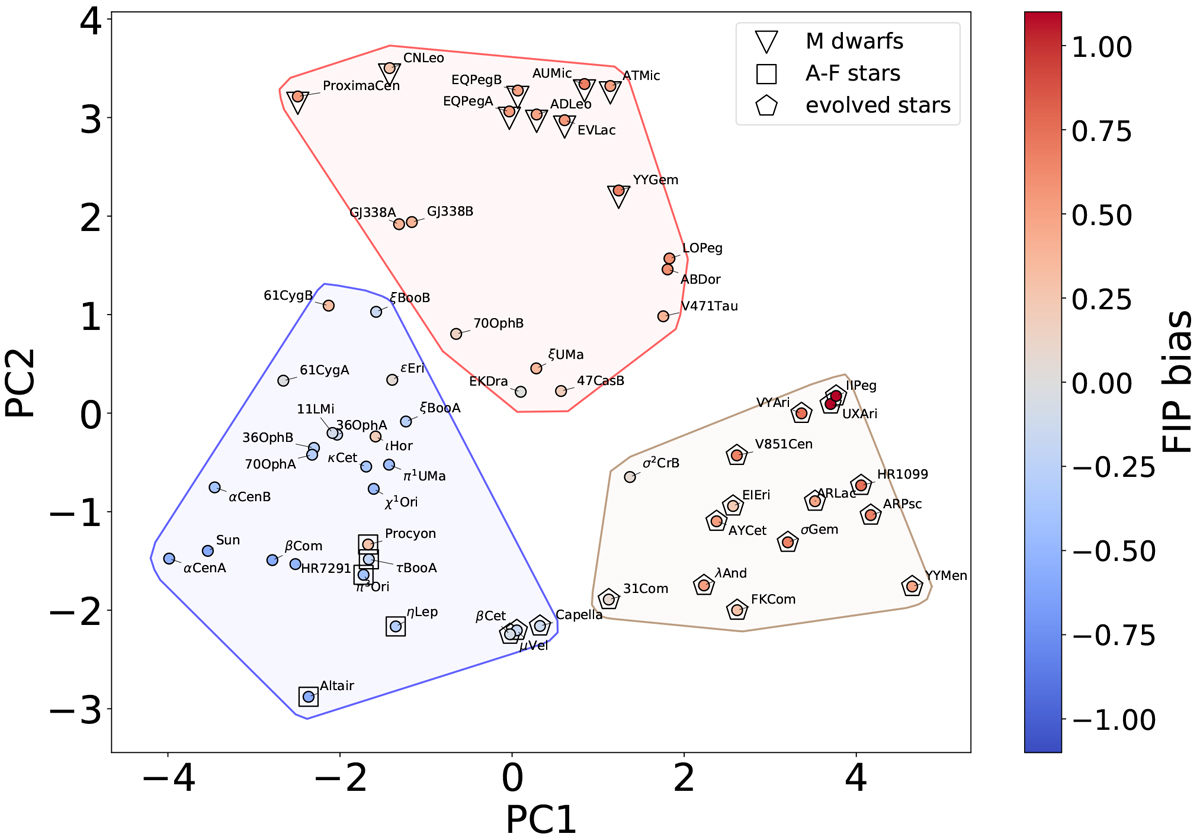
Download original image
First two principal components, coloured (in the symbols’ centre) with FIP bias. Special stars (evolved, M dwarfs and A–F stars) are indicated separately with different symbols. The clusters found with k-means are shown with red, blue, and brown polygons.
Current usage metrics show cumulative count of Article Views (full-text article views including HTML views, PDF and ePub downloads, according to the available data) and Abstracts Views on Vision4Press platform.
Data correspond to usage on the plateform after 2015. The current usage metrics is available 48-96 hours after online publication and is updated daily on week days.
Initial download of the metrics may take a while.