Fig. 7
Download original image
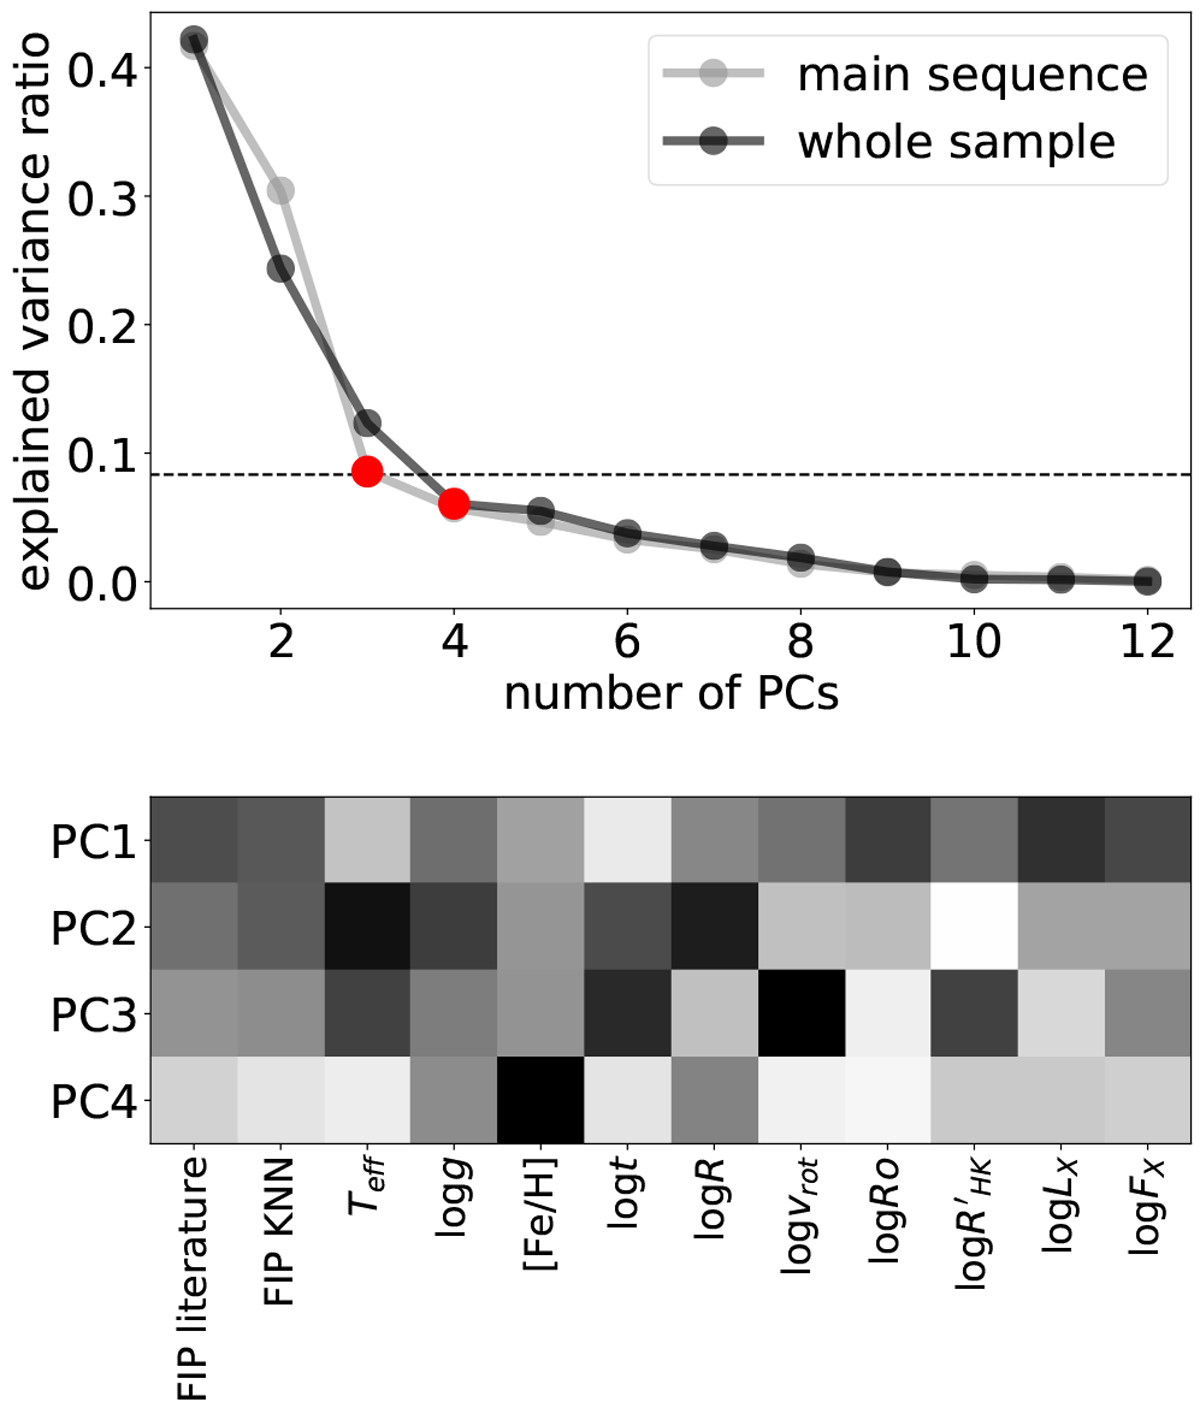
Results of the PCA. Upper panel: explained variance ratio of each principal component (PC). The dashed line denotes the Kaiser criterion (Kaiser 1960), and the red points show the elbow points. Lower panel: importance of each parameter to a given principal component, with darker colours indicating stronger contribution (in absolute values).
Current usage metrics show cumulative count of Article Views (full-text article views including HTML views, PDF and ePub downloads, according to the available data) and Abstracts Views on Vision4Press platform.
Data correspond to usage on the plateform after 2015. The current usage metrics is available 48-96 hours after online publication and is updated daily on week days.
Initial download of the metrics may take a while.