Fig. 5
Download original image
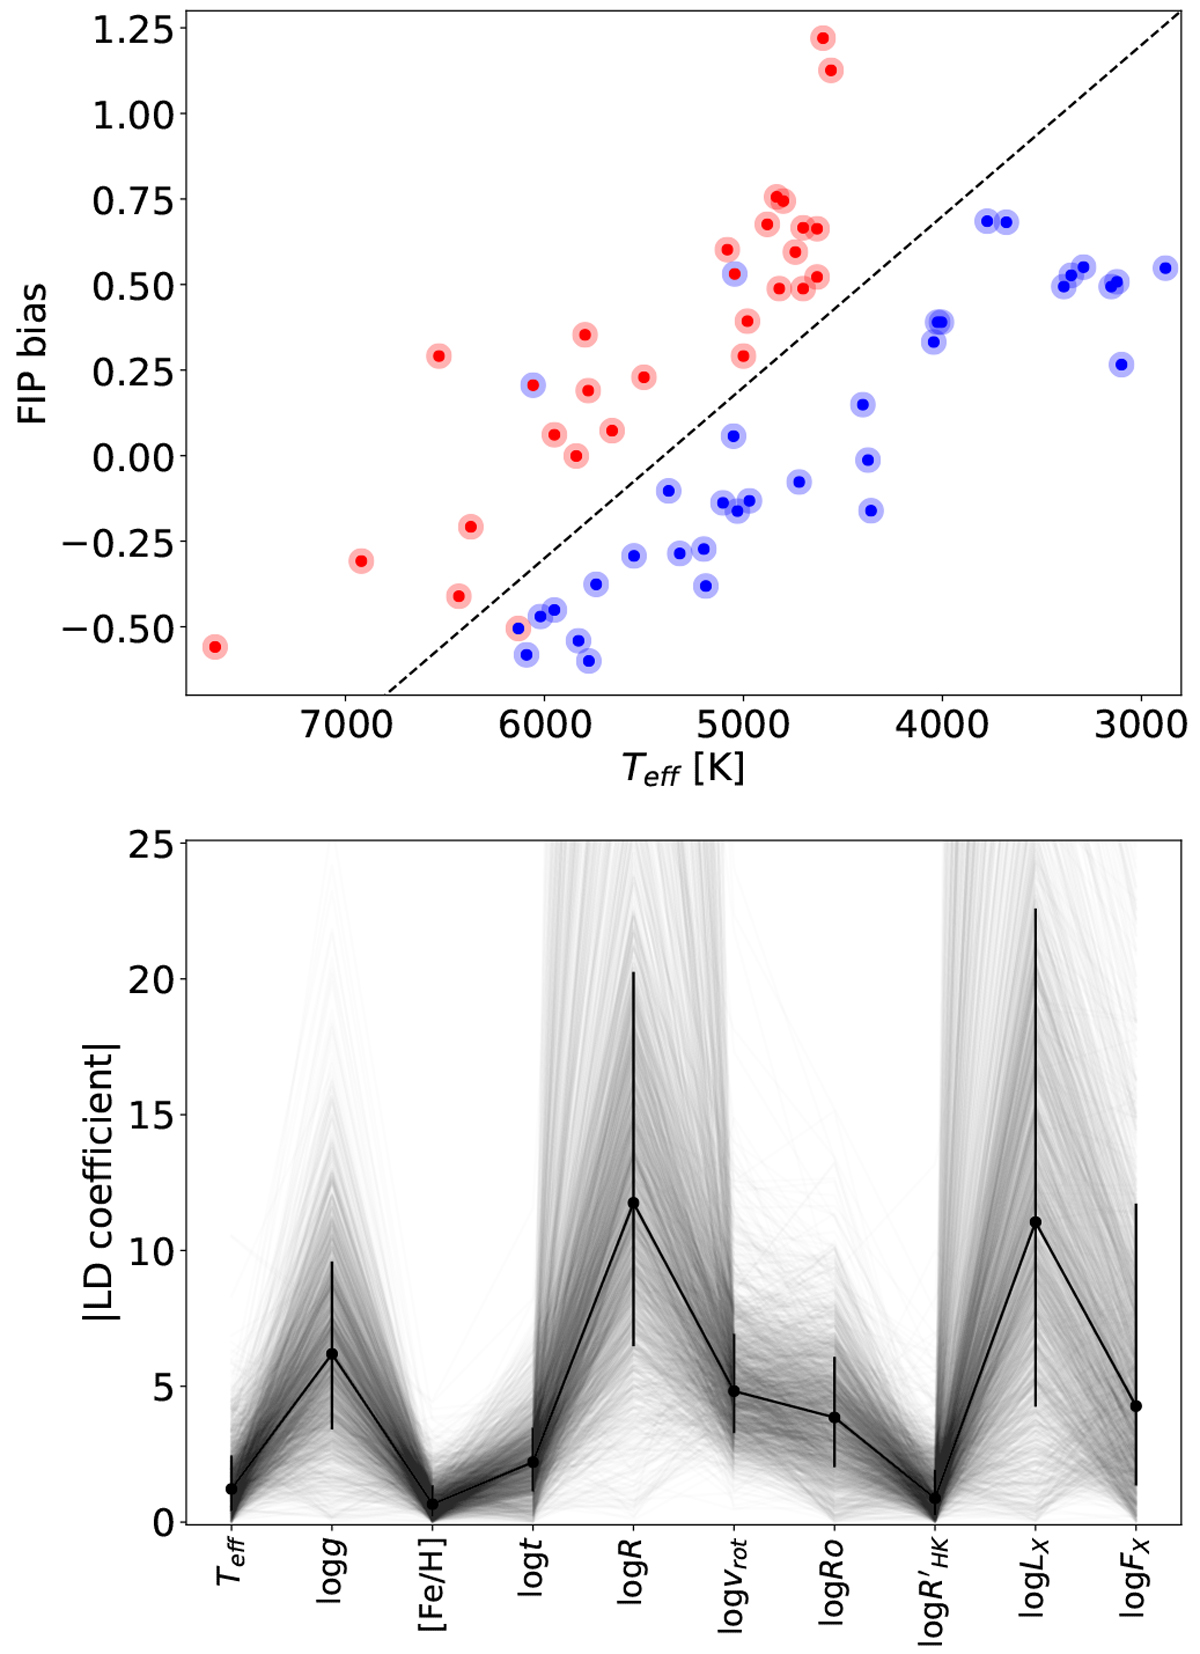
Results of linear discriminant analysis (LDA). Upper panel: pre-defined boundary between the two clusters (red and blue points) is shown with dashed lines on the Teff −FIP-bias diagram. The larger circles indicate the clusters assigned by the LDA. The three misclassified stars are ι Hor, HR 7291, and AY Cet. Lower panel: absolute value of the LD components corresponding to the given parameters. Thin lines come from bootstrap resampling, and error bars indicate the region between the 16th and 84th percentiles.
Current usage metrics show cumulative count of Article Views (full-text article views including HTML views, PDF and ePub downloads, according to the available data) and Abstracts Views on Vision4Press platform.
Data correspond to usage on the plateform after 2015. The current usage metrics is available 48-96 hours after online publication and is updated daily on week days.
Initial download of the metrics may take a while.