Free Access
Fig. 11
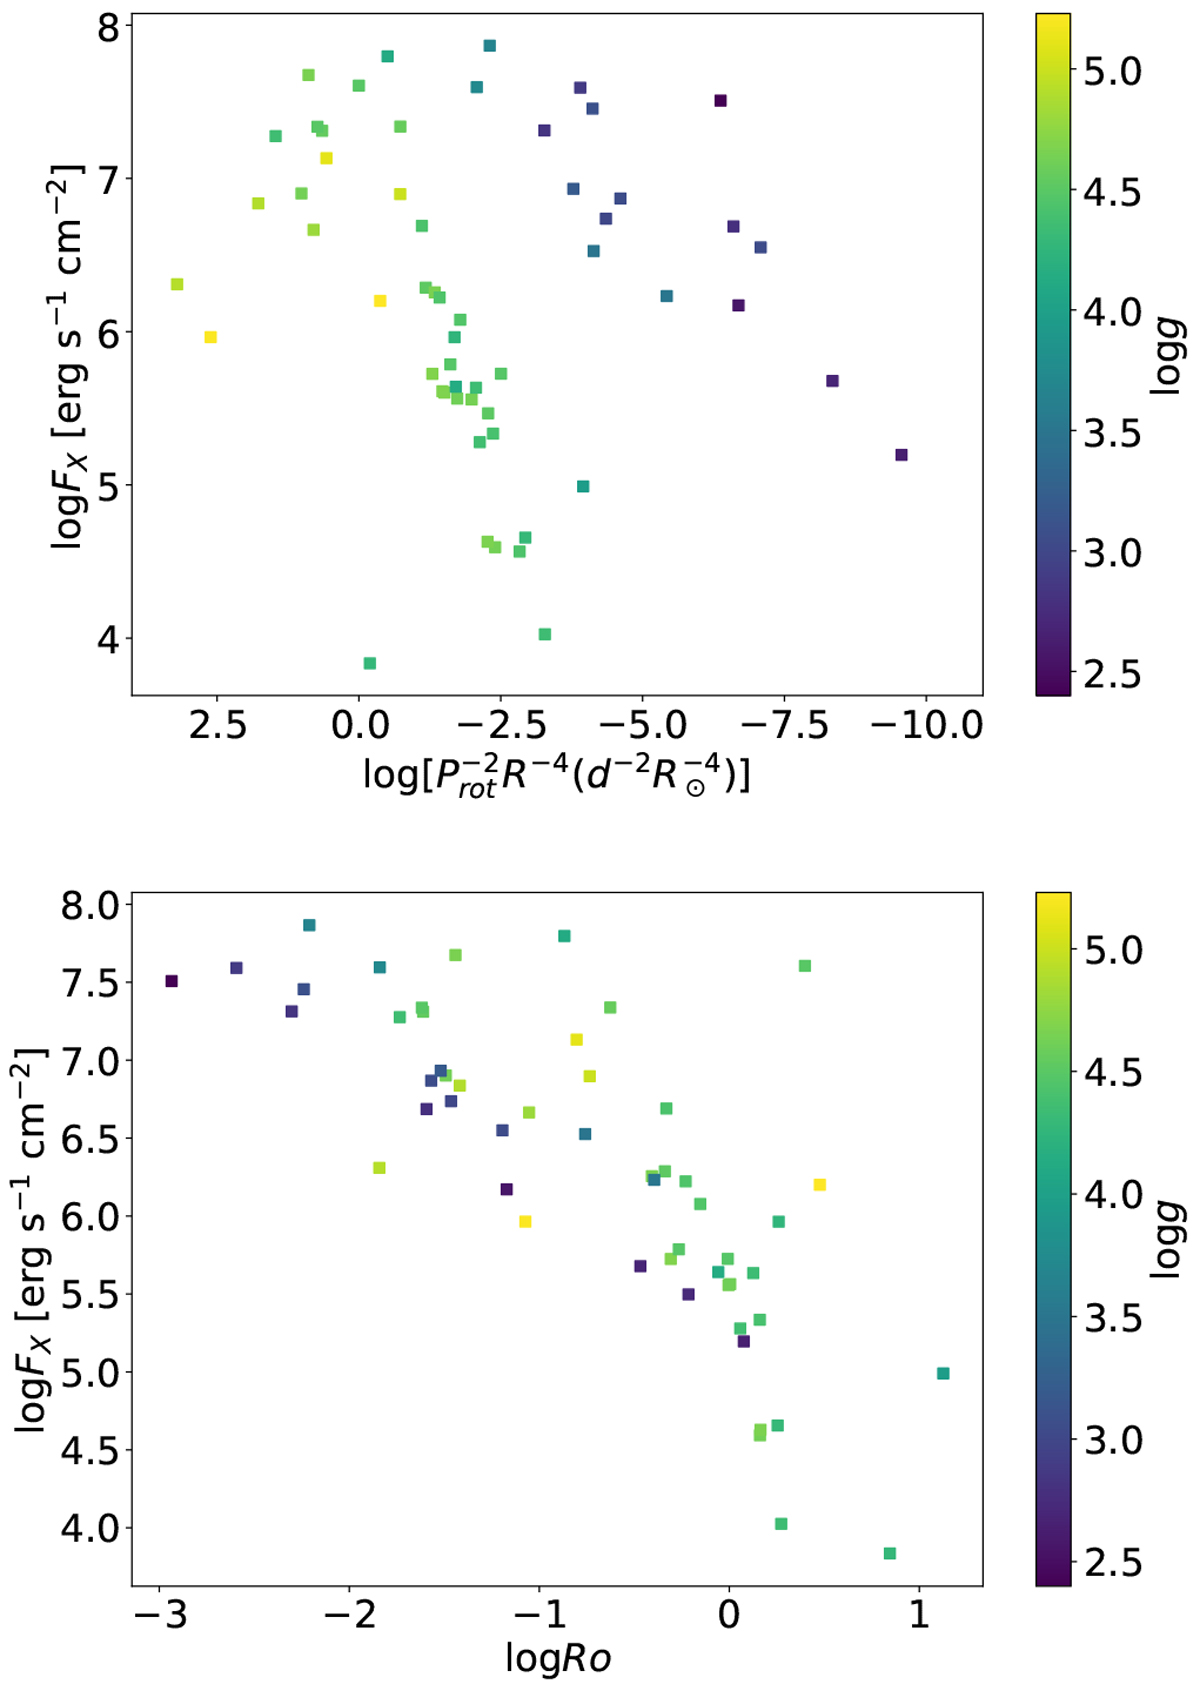
Download original image
X-ray flux as a function of stellar rotation. Upper panel: log FX vs. combined rotation period and stellar radius Lower panel: log FX vs. Rossby number as in Figs. 3b and 2a in Lehtinen et al. (2020), but with log FX instead of ![]() . The colour bars in both panels indicate surface gravity.
. The colour bars in both panels indicate surface gravity.
Current usage metrics show cumulative count of Article Views (full-text article views including HTML views, PDF and ePub downloads, according to the available data) and Abstracts Views on Vision4Press platform.
Data correspond to usage on the plateform after 2015. The current usage metrics is available 48-96 hours after online publication and is updated daily on week days.
Initial download of the metrics may take a while.