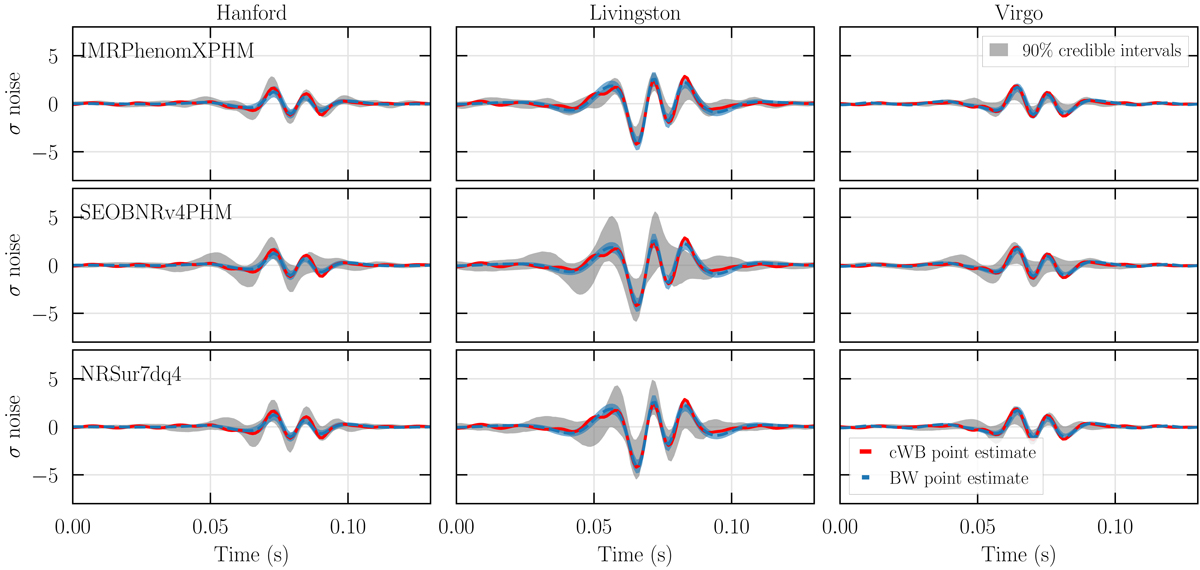
Fig. B.1.
Download original image
Consistency of the waveform reconstruction by cWB with three waveform models in the time domain: IMRPhenomXPHM (upper panel), SEOBNRv4PHM (middle panel), and NRSur7dq4 (lower panel). The colored solid red and dashed blue curves correspond to the whitened reconstructed event by cWB and Bayeswave, respectively. The blue shaded region corresponds to the 90% credible region from the event construction by BW. The gray shaded belts are reconstructed waveforms by cWB for the 90% credible interval corresponding to the PE runs.
Current usage metrics show cumulative count of Article Views (full-text article views including HTML views, PDF and ePub downloads, according to the available data) and Abstracts Views on Vision4Press platform.
Data correspond to usage on the plateform after 2015. The current usage metrics is available 48-96 hours after online publication and is updated daily on week days.
Initial download of the metrics may take a while.